“How have monetary policies affected inflation in Austria for the last 5 years (2019-2024)?”
Introduction
This thesis investigates the impact of monetary policies on inflation in Austria over the last five years - from 2019 to 2024. My research aims to explore how measures such as interest rate adjustments and quantitative easing implemented by the European Central Bank (ECB), have influenced the inflation rate during this period. To analyse this relationship, I have applied a combination of economic theories; for instance, Quantity Theory of Money and Keynesian economics, accompanied by data from Austrian economic reports. I expected to find a negative correlation between interest rate and inflation as economic theory suggests that the higher the interest rates, the lower the inflation rate. The findings, however, proved a positively linear correlation between monetary policy actions and inflation trends. Such economic theory is not always applicable in a real world context in terms of policy interventions in stabilising inflationary pressures. This is because there are many external factors that affect variables which are not taken into account. Overall, the research provides insights into the role of monetary policy as a tool for managing inflation in Austria.
Monetary policy plays a vital role in shaping a country's economic landscape. Primarily it influences factors such as inflation, employment and overall economic growth. This financial tool serves as a key mechanism for Central Banks and governments to manage the economy by adjusting interest rates and the money supply. Interest rates are the cost of borrowing and the reward for saving, they have varied from 0% to 4.5% (European Central Bank, 2024). With recent disruptions in the markets in the eyes of humanitarian crises such as the COVID-19 Pandemic, nations around the globe struggled with challenges to keep economic growth whilst maintaining an acceptable inflation rate. Inflation is defined as a sustained rise in the general price level, and it reached a peak of 11.6% in October 2022; the Central Bank’s target is 2% (World Bank, 2024). These challenges have tested the resilience and effectiveness of monetary policies and have led to significant shifts in economic strategies across various countries.
Austria is part of the European Union and it has experienced major financial setbacks throughout the last 5 years. Being a member of the eurozone, decisions regarding the country’s monetary policy are taken by the European Central Bank (ECB). This means that Austria is influenced by the European Central Bank regarding interest rate adjustments. However, unique economic conditions within Austria have played a role in shaping how these policies have translated into actual outcomes in comparison to aims and expectations. Furthermore, the interaction between global economic occurrences, such as shifts in energy prices, geopolitical events and supply chain issues, have added to the complexity of Austria's inflationary pressures. These external factors, outside of the control of Banks in the Eurozone, combined with local policy responses, create a versatile environment. This makes it essential to analyse how Austria’s monetary policy has adapted to these evolving challenges and whether its main role of changing aggregate demand was effective.
The analysis will begin with a detailed examination of Austria’s inflation rates from 2019 to 2024, linking these trends to specific monetary policy actions, thus setting the stage for a deeper understanding of the relationship between monetary policy and inflation within this period.
COVID-19 Pandemic
Monetary policy is a tool used by the Central Bank to control inflation and economic growth. The COVID-19 Pandemic was the first challenge that Austria had to battle. The Austrian government implemented a “hard” lockdown on the 17th November 2020, where non–necessity shops had to shut and a curfew was put in place (Pollak, Kowarz and Partheymüller, 2021). As consumers could not leave their homes to the high street and spend their income, it resulted in a significant drop in spending. A drop in consumption is damaging to the economy as it would ultimately cause a decrease in the economic growth of Austria. During the pandemic, the European Central Bank used expansionary monetary policy, thus it kept interest rates at 0% (European Central Bank, 2024). The ECB also used quantitative easing, which was initially introduced to increase confidence after the financial crisis of 2008/2009. Quantitative easing is when the Central Bank buys securities and bonds from other banks, which increases the money supply in an economy, resulting in a further decrease in interest rates as banks are more likely to lend money. This should aid the economy when it is stuck in a liquidity trap, which occurs when there is a lack of consumer confidence. The ECB initiated a pandemic emergency purchase programme (PEPP), where it bought €1,850 billion worth of assets, such as buying bonds directly from banks (European Central Bank, 2020).
The rationale behind decreasing the interest rates was to increase consumption and investments at a time of low consumer confidence, as borrowing was cheaper and the reward for saving was lower. Using the Austrian Consumer Confidence Indicator, consumer confidence dropped by 90% after the pandemic lockdown began in February 2020 to April 2020 (Oenb.at, 2020). Moreover, the Austrian economy fell into a recession in the first half of 2020 as it experienced two consecutive quarters of negative GDP (Qu and Zhang, 2015). However, as the ECB left interest rates at 0%, it allowed consumers to gain confidence back, and by June 2021, consumer confidence increased by around 95%(Oenb.at, 2020). This meant that monetary policy worked to guarantee that the Austrian Economy did not go into a deeper recession as in Q3 of 2020, GDP growth was 11.3% (Beer et al., 2024).
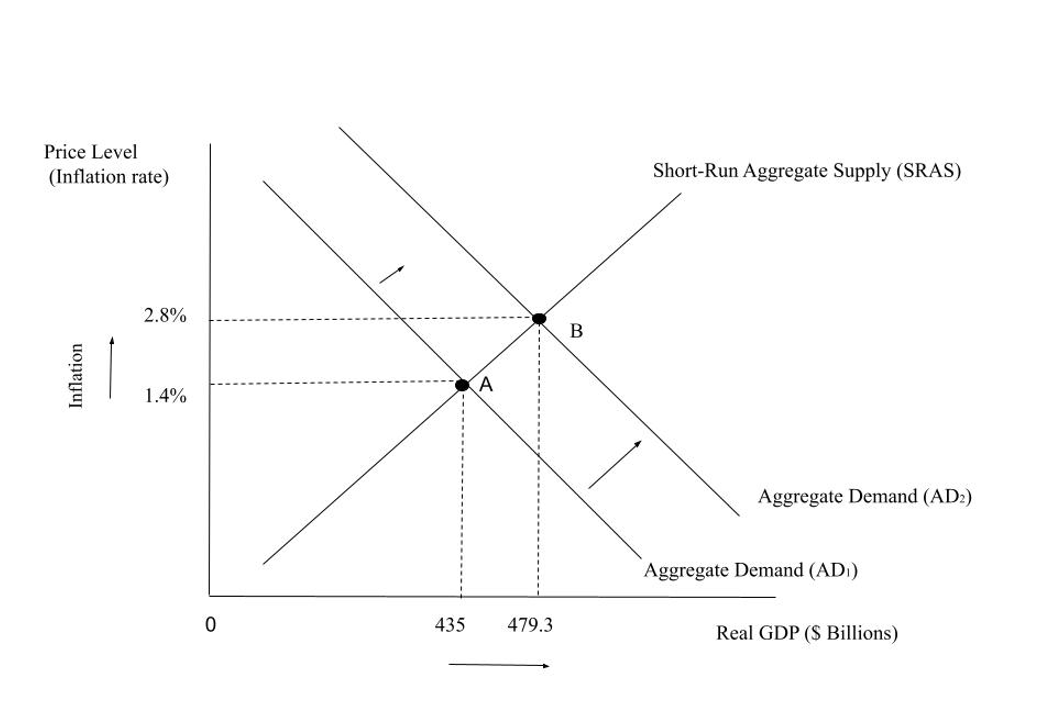
Figure 1 - Expansionary Monetary Policy in Austria (2020-2021)
As shown by figure 1, expansionary monetary policy resulted in an increase in aggregate demand from AD(1) to AD(2). Aggregate demand is defined as the total amount of goods and services demanded in an economy at a given time and price level. It can be measured with the following formula:
As consumption and investments are components of aggregate demand, an increase in them will ultimately cause aggregate demand to increase too. This resulted in an increase in the GDP of Austria from $435 billion to $479.3 billion and an increase in the price level from 1.4% to 2.8% (The World Bank, 2024). Lower interest rates will also result in a positive wealth effect. As interest rates decrease, mortgage rates will also fall, which means that the demand for houses will increase, resulting in people feeling wealthier. This would increase consumer confidence, resulting in a further improvement in consumption.
Furthermore, expansionary monetary policy is used to avoid deflation. Deflation is when there is a sustained fall in the general price of level. Deflation could be damaging to the Austrian Economy as it may cause a deflation spiral, this is when consumers wait for prices to decrease further, meaning that consumption will stall, which would further decrease aggregate demand, causing more deflation. By using expansionary monetary policy, the price level increases, resulting in demand-pull inflation. Between 2019-2021, Austria never experienced deflation, and inflation only dropped as low as 0.7% (The World Bank, 2024). Demand-pull inflation can have damaging effects to the Austrian economy as it has regressive impacts, this is because lower income households will have to spend a higher proportion of income on goods and services compared to higher income households. Nonetheless, it was crucial for the economy to experience some inflation as otherwise Austria would have fallen into a deeper recession, which could have had even more damaging consequences.
COVID-19 Pandemic - Aftermath
After COVID-19, there was a rapid increase in the aggregate demand in Austria as the government announced lockdown rules to be eased. In February 2022, Austria allowed restaurants and shops to extend their opening times and it allowed those who were not vaccinated to enter non-essential shops again. (Brenna Hughes Neghaiwi, 2022). This caused a boost in consumption levels, resulting in a further increase in aggregate demand. Of course, when discussing the rates at which interest rates take into effect it is notable that different segments of the economy get affected at different times. Typically, the effects are categorized into three stages: short-term (consumer loans within 3 months), medium-term (mortgages, loans, and business investments within 3–12 months), and long-term (employment, output, and inflation within 12–24 months) (New York Post, 2024). Analysts have researched that interest takes between 6-9 months to take effect (Gupta, 2024). Therefore, it is reasonable to assume that the boost in aggregate demand was also caused by the low interest rates. As aggregate demand increases, demand-pull inflation also increases as shown by figure 2, where the price level increases from 1.4% to 2.8%. This caused inflation to reach a peak of 7.8% in Q4 of 2022 (The World Bank, 2024).
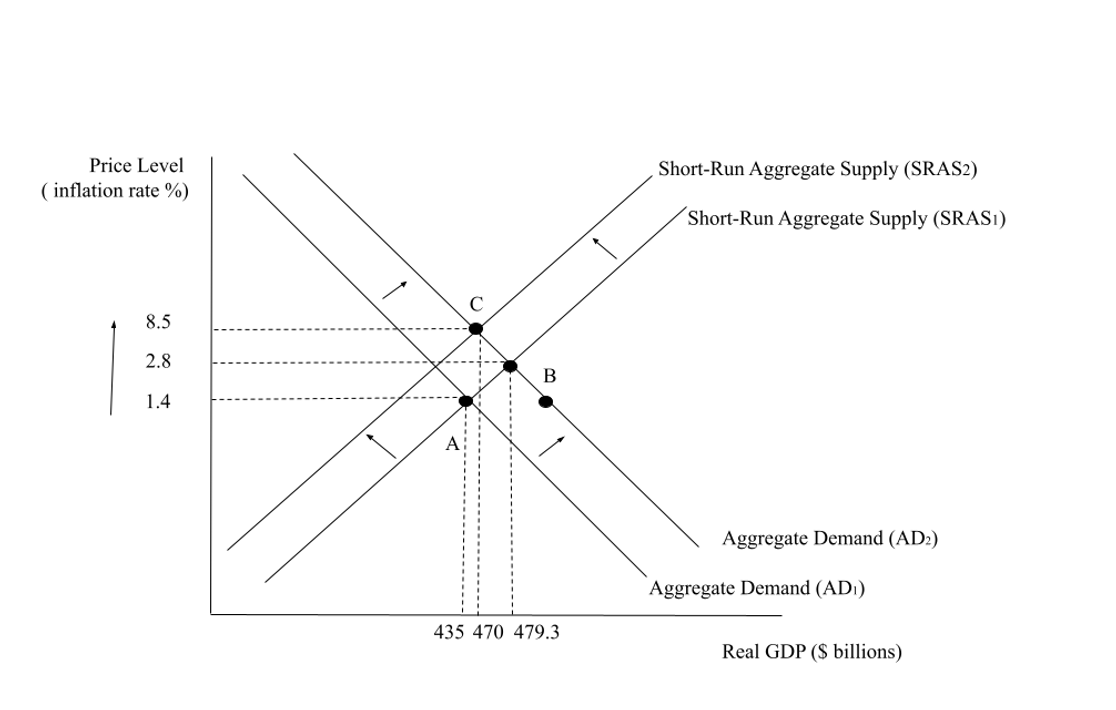
Figure 2 - Cost-Push and Demand-Pull Inflation in Austria (2020-2022)
Diagram not to scaleOmission Note: In this exploration I opted not to create the diagram to scale due to the significant disparity in the values being represented. The data includes values with jumps that are disproportionately large, making it impractical to graphically display them on a single, comprehensible scale. Attempting to do so would result in either an overcrowded visualization where smaller values become negligible or a distorted graph that sacrifices accuracy. Instead, I focused on providing a clear representation of trends and patterns through proportionally adjusted visuals, ensuring clarity while maintaining the integrity of the analysis.
However, the inflation that occurred all over Europe was also caused by supply-side issues. For example, after the EU enforced sanctions on Russia on the 24th February 2022, oil prices increased rapidly as Russia is one of the main exporter of oil in the EU (European Council, 2024). This meant that the costs of production increased, causing the Short Run Aggregate Supply curve to shift from SRAS (1) to SRAS (2), causing a further increase in prices as shown in figure 2, where the price level increased to 8.5%. The COVID-19 pandemic also caused further supply chain disruptions such as shortages in the computer chip manufacturing industry. Inflation caused by a decrease in SRAS is called cost-push inflation and it is extremely damaging as it also caused a decrease in GDP to $470 billion.
In this case, contractionary monetary policy could aid the economy as higher interest rates will decrease spending as borrowing costs increase, and lower consumption, combined with lower investments will reduce aggregate demand, thus altering inflation. For instance, due to higher spending and consumption, Brazil employed an identical strategy to combat inflation. As of September 2024, Brazil's central bank raised its benchmark interest rate, the Selic rate, by 25 basis points, reaching 10.75%. This served as a response to the continuously increasing inflation. By increasing interest rates, the cost of borrowing became more expensive, discouraging both consumer spending and business investments. In theory this should mitigate the climbing inflation. (Reuters, 2024).
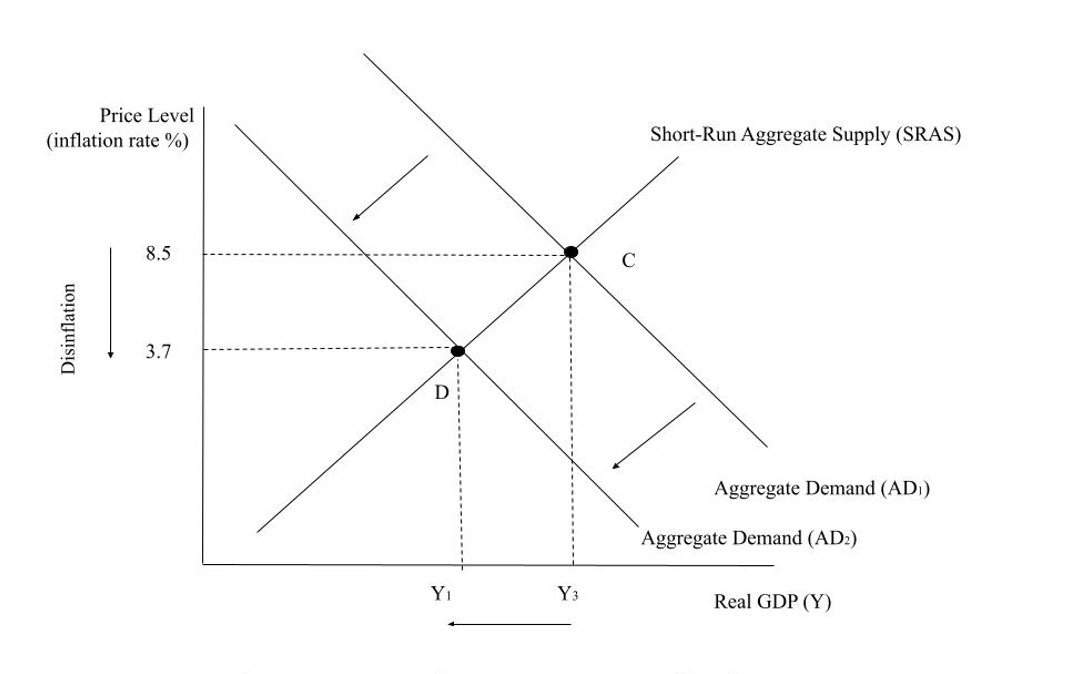
Figure 3 - Contractionary Monetary Policy in Austria (2022-2024)
This should reduce the demand pull inflation in Austria as shown by figure 3, where aggregate demand shifts from AD(1) to AD(2). This resulted in a fall in the price level to 3.7%. Nonetheless, this can also dampen the economic growth of the economy as real GDP falls from Y(3) to Y(1). Yet, in Austria, this did not occur and GDP rose to $516 billion (The World Bank, 2024).
Throughout this analysis, I will be using secondary data since the data required has already been gathered. Specifically, I will be using data from The World Bank, which is a reliable source of information as it uses statistical systems from member countries (The World Bank, 2019). For interest rates values, I have used data from the European Central Bank (ECB), which guarantees that the information and the statistics are accurate. To ensure accuracy, for interest rates values I used annual averages when the ECB’s monetary policy committee made adjustments.
I will focus on the Consumer Price Index (CPI) as the measure of inflation as it is widely used and recognised globally. CPI is a weighted price index that calculates the difference in the monthly prices of a basket of goods. A basket of goods includes around 800 goods that people spend their most income on. My analysis will explore the relationship between interest rates and inflation. I will also include Gross Domestic Product (GDP) values to assess the impacts of interest rates on economic growth. If inflation is high and so is GDP, that will imply that there is demand-pull inflation, so monetary policy should work. However if there is high inflation and low economic growth, this results in stagflation, thus cost-push inflation. Interest rates is the independent variable whilst inflation is the dependent variable as it is the one that is measured.
I expect to find an inversely proportional relationship between interest rates and inflation, where lower interest rates correspond with higher demand-pull inflation. For the 2024 data, I will use the average from the first half of the year, thus the first and the second quarter.
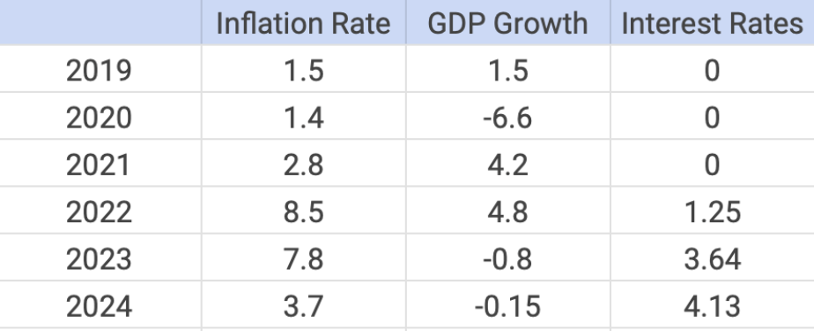
Figure 4- Table Showing Austria’s Key Indicators
Figure 4 shows the inflation rate, GDP growth and interest rates in Austria from the year 2019 to 2024. And Figure 5illustrates the data graphed; the graph suggests that there is a relationship between higher interest rates and higher inflation.
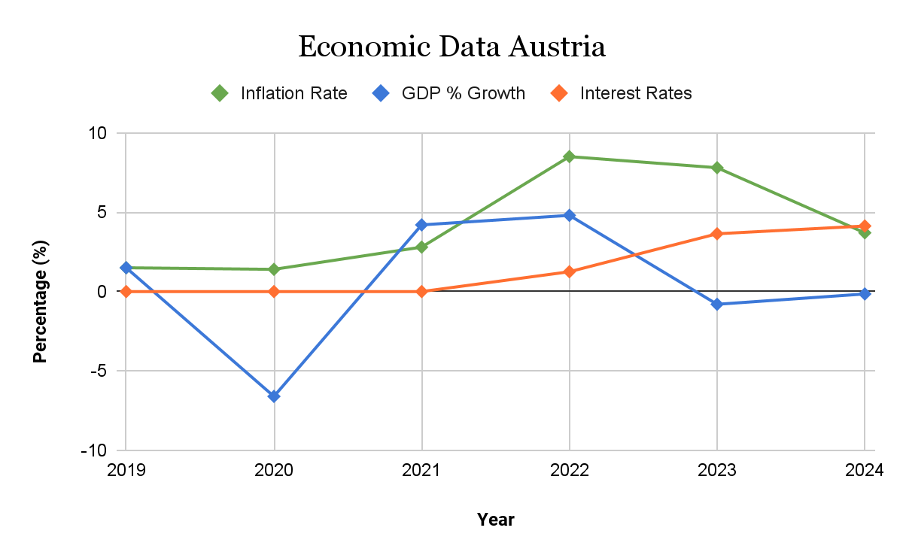
Figure 5- Graph illustrating GDP Growth, Inflation rate and Interest Rates in Austria
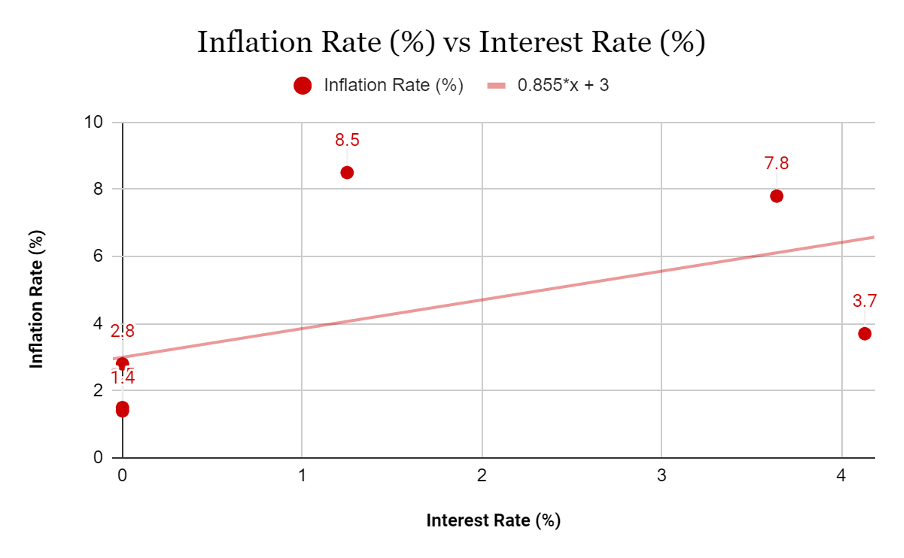
Figure 6- Graph showing the relationship between inflation rates and interest rates
Using the data from Figure 4, I calculated the correlation between the interest rates and inflation, the result was 0.5243, which suggests a weak positive relationship. This might insinuate that interest rates do not really affect inflation as the value is not very close to 1. However, as Figure 6 suggests, 2022 could be counted as an outlier as the inflation rate suddenly shot up to 8.5%. If in the analysis, the outlier is ignored, then the correlation calculated is 0.8159. This number represents a strong positive linear correlation between interest rates and inflation, which is not what we expected. The positively linear relationship proposes that the higher the inflation rate, the higher the interest rates. As previously mentioned, in economic theory, higher interest rates should cause lower inflation.
Furthermore, Figure 6 illustrates the linear relationship between the two variables. The equation suggests that for every 1% increase in interest rates, inflation rises by 0.855%. The y-intercept (3), suggests that when the interest rates are 0%, the inflation rate is 3%. The positive correlation may reflect delayed or insufficient policy responses to inflation spikes. The graph shows the outlier when interest rates are 1.25, which represents an external shock, the COVID-19 Pandemic. As the interest rate reaches 4%, inflation has decreased to 3.7%, which might indicate the start of monetary policy taking effect to bring inflation down. It can therefore be concluded that the ECB is increasing interest rates after inflation occurs to try and decrease it, which is why there is a positive correlation. Moreover, it can be concluded that higher interest rates do not immediately impact the inflation rate. In this case, interest rate adjustments are considered a reaction to cope with inflation. However, using economics theory, it should be the opposite.
Evaluation
CPI Limitations
When using metrics that would represent the effectiveness of the taken measures it is important to mention that the Consumer Price Index (CPI) has several limitations. Firstly, it does not include housing costs, which tend to be the biggest proportion of income spending for households. Throughout the analysis, CPI was used, which means that it was not fully captivating the increase in costs that Austria experienced. CPIH, on the other hand, includes housing costs. In Austria, in August 2024 CPIH was 132.5 points, whilst CPI was 123.7 points (Statistics Austria, 2024). This shows how the analysis conducted could have been affected by this data as it was not fully capturing the price changes. Secondly, CPI does not account for shrinkflation. Shrinkflation is when firms cut costs by reducing the physical volume of products but keeping the prices the same. Mathematically, this makes goods more expensive as the price per unit rises, however, in the statistics, this is not accounted for. This is a type of ‘hidden inflation’ as it is a qualitative aspect that cannot be quantifiable. This could have therefore affected the results furthermore.
Supply side implications
Nonetheless, as previously mentioned, the geopolitical tensions globally have affected European supply chains, which means that, as shown in Figure 3, inflation in Austria for the past 3 years was mainly caused by lower supply and not higher demand. In 2022, when the Russian invasion of Ukraine took place, inflation reached a peak of 11.6% in October 2022, however the interest rates rose from 0% to 1.25%, suggesting that monetary policy did not particularly affect inflation. Monetary policy mainly affects the components of aggregate demand, making it difficult to mitigate the consequences of low aggregate supply. However, it can be argued that monetary policy acted as a shield to prevent further inflation from demand. If aggregate demand further increased, it might have resulted in the peak of inflation to be even higher, therefore by using contractionary monetary policy immediately after inflation began, guaranteed safety for the economic outlook.
FIscal policy
Moreover, another way aggregate demand is affected is through fiscal policy. Fiscal policy refers to when the government changes the levels of tax and government spending to manipulate aggregate demand. Expansionary fiscal policy is when the government increases its spending and decreases taxes, whilst expansionary fiscal policy is when the government cuts spending and increases tax. As government spending is a component of aggregate demand, it will directly impact it, taxes, on the other hand will indirectly impact it through changes in consumption and investments. Throughout COVID-19, the Austrian Government took several fiscal measures, for instance it reduced Value Added Tax (VAT) for certain service sectors, such as hotels. Moreover, it increased its government spending through turnover compensation and a short-term work scheme to help workers (Weyerstraß, 2021). The government implemented these policies to stimulate the economy even more alongside expansionary monetary policy. Therefore, it is important to point out the significance of other measures that might have impacted inflation in Austria, not just monetary policy.
Furthermore, as previously mentioned, interest rates take an average of nine months to take full effect. During the analysis, this was not accounted for; thus, the results could have been affected as there could be a negative correlation if I accounted for the time period required. Fiscal policy, on the other hand, has a much more immediate effect on aggregate demand.
COnclusion
In conclusion, monetary policy does not appear to have a significant impact on CPI inflation in Austria. This was a result of the analysis I conducted, showing a positive linear relationship. A positive linear relationship indicates that the higher interest rates, the higher the inflation and vice versa. However, using economic theory, it should be the opposite; where the higher the interest rates, the lower the inflation rate should be.
It can be argued that monetary policy for the past 5 years in Austria has not worked as the high inflation was caused by supply-side issues, such as higher oil prices and global shortages. A decrease in the Short Run Aggregate Supply causes cost-push inflation, which is not affected by interest rates as interest rates mainly affect aggregate demand due to their direct impact on consumption and savings. This could therefore be an explanation to why interest rates have not been as efficient as economic theory suggests.
Nonetheless, the implementation of contractionary monetary policy meant that aggregate demand stayed low, thus demand-pull inflation did not occur on top of the cost-push inflation. Thus, monetary policy was successful at avoiding higher inflation spikes in Austria.
Overall, monetary policy had an ambiguous effect on the Austrian economic outlook as economics theories often do not unveil and take into full consideration external factors and focus on assumptions.
Bibliography
Beer, C., Fritzer, F., Prammer, D., Schneide, M., Sellner, R., Stiglbauer, A. and Vondra, K. (2024). OeNB Report 2024/2: March 2024 Interim Economic Outlook for Austria - Oesterreichische Nationalbank (OeNB). Available at: https://www.oenb.at/en/Publications/Economics/reports/2024/report-2024-2-outlook/report-2024-outlook-html.html (Accessed: 15th September 2024).
Brenna Hughes Neghaiwi (2022). ‘Austria to further ease COVID restrictions’. Reuters. Available at: https://www.reuters.com/world/europe/austria-begin-easing-coronavirus-restrictions-feb-5-2022-01-29/ (Accessed: 29th September 2024).
European Central Bank (2020). Our response to coronavirus (COVID-19). European Central Bank. Available at: https://www.ecb.europa.eu/home/search/coronavirus/html/index.en.html (Accessed: 22nd September 2024).
European Central Bank (2024). Key ECB Interest Rates. European Central Bank. Available at: https://www.ecb.europa.eu/stats/policy_and_exchange_rates/key_ecb_interest_rates/html/index.en.html (Accessed: 22nd September 2024).
European Central Bank (2024). Key ECB Interest Rates. European Central Bank. Available at: https://www.ecb.europa.eu/stats/policy_and_exchange_rates/key_ecb_interest_rates/html/index.en.html (Accessed: 1st October 2024).
Gupta, N. (2024). How Long Does It Take for Rate Cuts by The Fed to Percolate to The Economy? Sganalytics.com. Available at: https://us.sganalytics.com/blog/how-long-does-it-take-for-rate-cuts-by-the-fed-to-percolate-to-the-economy/ (Accessed 9 Jan. 2025).
Herzlich, T. (2024). When will Americans feel relief from the Fed’s interest rate cuts? New York Post. Available at: https://nypost.com/2024/09/18/business/when-will-americans-feel-relief-from-the-feds-interest-rate-cuts/ (Accessed 21 Dec. 2024).
Oenb.at. (2020). Consumer confidence indicator - Oesterreichische Nationalbank (OeNB). Available at: https://www.oenb.at/en/Statistics/Standardized-Tables/International-Comparisons/Economic-Indicators/Consumer-Confidence-Indicator.html (Accessed: 28th September 2024).
Pollak, M., Kowarz, N. and Partheymüller, J. (2021). Chronology of the Corona Crisis in Austria - Part 4: Lockdowns, mass testing and the launch of the vaccination campaign. Available at: https://viecer.univie.ac.at/en/projects-and-cooperations/austrian-corona-panel-project/corona-blog/corona-blog-beitraege/blog100-en/ (Accessed: 29th September 2024)
Qu, C. and Zhang, Y. (2015). ‘Deep, But Short Recession in Austria’. Gastroenterology, 148(5), p.1075. doi: https://doi.org/10.1053/j.gastro.2015.03.036 (Accessed: 28th September 2024).
Ayres, M. (2024). Brazil central bank raises rates by 25 bp, first hike in two years. [online] Reuters. Available at: https://www.reuters.com/markets/rates-bonds/brazil-central-bank-raises-rates-by-25-bp-first-hike-two-years-2024-09-18/.
Statistics Austria (2024). Consumer price index (CPI/HICP). STATISTICS AUSTRIA. Available at: https://www.statistik.at/en/statistics/national-economy-and-public-finance/prices-and-price-indices/consumer-price-index-cpi/-hicp (Accessed: 3rd October 2024).
World Bank (2024). World Bank Open Data. World Bank Open Data. Available at: https://data.worldbank.org/indicator/NY.GDP.MKTP.KD.ZG?end=2023&locations=AT&start=1961&view=chart(Accessed 3 Oct. 2024).
World Bank (2024). Inflation, consumer prices (annual %) - Austria | Data. data.worldbank.org. Available at: https://data.worldbank.org/indicator/FP.CPI.TOTL.ZG?locations=AT (Accessed: 28th September 2024).
World Bank Group (2019). About us | Data. Worldbank.org. Available at: https://data.worldbank.org/about (Accessed: 1st October 2024).