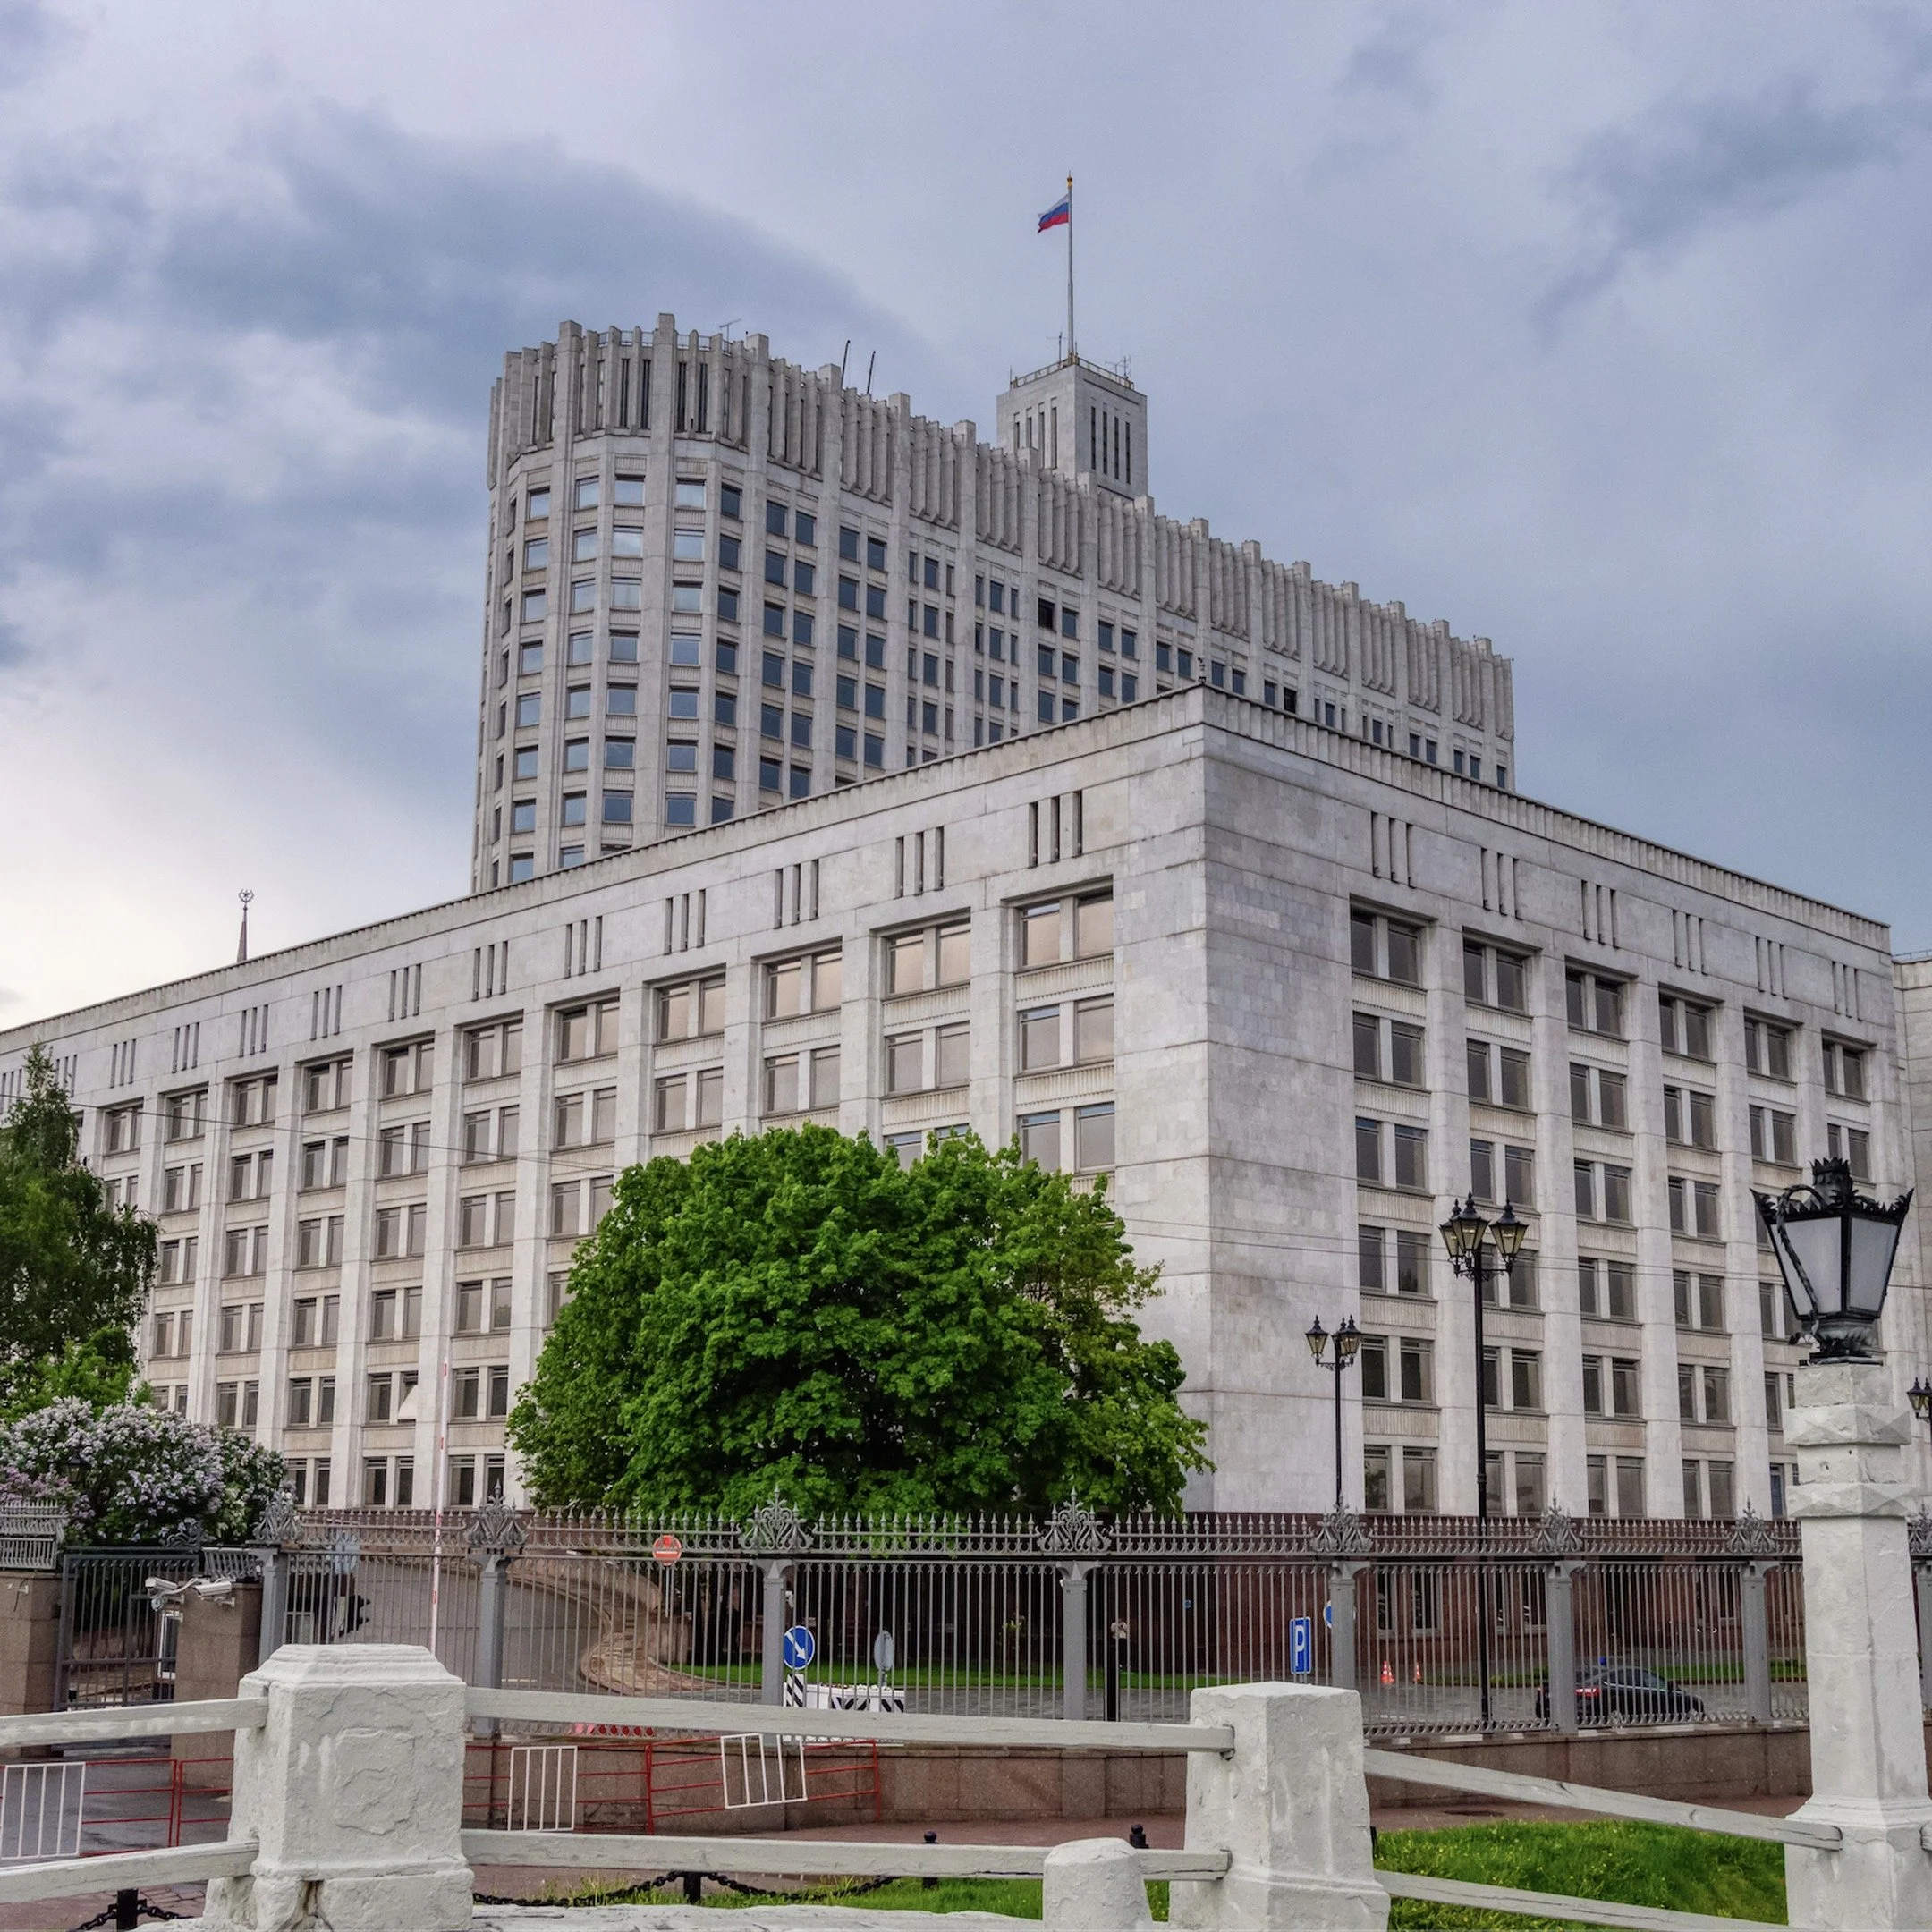
Russian White House, Moscow.
If you buy into the S&P 500 today, the companies in it earn 2.45% a year on what you paid, based on their average profit over the last ten years. At the same time, the inflation-protected ten-year US Treasury pays you 2.6% on top of inflation.1
So the government bond pays more than the stock market, and investors are getting nothing extra for the larger risk of holding stocks. Robert Shiller, the Yale economist who won the Nobel Prize in economics in 2013, keeps data on this gap going back to 1881. On his numbers, the gap between stocks and government bonds has dropped below zero three times since 1900: in 1929-30, 1936-37 and 1999-2000. Each time, stocks lost about half of their value or more within three years.2
The S&P 500, the most widely tracked index in the world, is a good indicator of where the world economy is headed. It currently trades at 40.8x its cycle-adjusted earnings. This is Robert Shiller's measure of how expensive the companies inside the index are: the index divided by its average profit over the past ten years, adjusted for inflation. The median reading since 1881 is 16.6x. Since May this year the value has been above 40x. More alarming still, the only other time the index has been this high was the run-up to the dot-com peak, when values of over 44x were recorded in December 1999.3
Further, the ten largest companies, out of 500, make up 39.2% of the index. For reference, in 2017 the top ten made up 23.9% of the S&P. At the height of the dot-com bubble, that number was about 25%.4 But the issue is not the percentage itself; it is what has caused the growth. As of November 2026, most of these ten companies are building, selling, financing or supporting artificial intelligence. “Diversified” owners of the index therefore have a near 40% bet on AI alone.
The five largest US cloud-computing companies will spend between $780bn and $800bn this year, most of it on data centres and chips to support AI. The worst part is that more and more of it is borrowed every year. So where does this mountain of debt bring us? In 2024 new debt covered 9% of their investment. By June 2026 the figure had risen to 32%. The cumulative value of their debt has reached $700bn, and Larry Ellison's Oracle plans to raise $10bn in new shares and $10bn in bonds to keep building.5
Here comes the interesting part: lenders are pulling back from the industry. AI-related debt issuance fell from $113bn in June this year to just $23bn in September. JPMorgan says it is cutting down on lending to the AI sector.6 CoreWeave, the largest company that rents out AI chips, pays more than 15% on its long-term debt, a rate normally charged to companies at risk of default.7
The International Monetary Fund found 14 deals since 2023 in which large tech firms poured about $300bn of equity and $650bn of debt into smaller AI companies. What did these companies promise in return for the financing? $1.4tn of future spending, much of it with the large companies that funded them.8 What does not make sense here is that the large firms are counting on future revenue that depends on money they lent out themselves. Put simply, they expect money not from an outside customer but from their own money coming back, disguised as revenue. On the surface this seems fine: what is wrong with helping a company that then does business with you? There are three problems. First, investors value large firms on their sales growth; if part of those sales is self-funded, the demand for AI appears larger on paper than it is, and valuations may be misleading. Second, if a start-up that has been invested in fails, the large firm loses its investment and its future sales at the same time: the failure hits twice. Third, as we have seen with AI, the whole build-out depends on continuous funding. If the bond market stops or the big companies cut funding, the sales stop as well, and the effect runs through every player in the chain.
The cloud giants now issue 10% of the world's investment-grade corporate bonds, up from 1% in 2024. In October the IMF itself listed an AI correction as one of three “plausible near-term catalysts” for market turmoil.8
Alongside the AI build-out, borrowing has become significantly more expensive. At the end of February 2026, before the war with Iran, the ten-year Treasury yield was under 4%. On 7 October it rose above 5.35%, its highest since 2002, and the 30-year reached 5.7%.9 Consumer prices rose 0.6% in September and 3.7% over the year. The hardest hit was the energy sector, as a consequence of the war in Iran: up 20.4%.10 The US Federal Reserve raised rates to 3.75-4.00% in September and held them in October. As for where Fed rates go next, the signals are clear: two policymakers voted for a hike in October, and markets put the chance of a hike in December at 85%.11 The US ran a deficit of about $2tn in the last fiscal year and now pays about $1tn a year in interest.12 The same trend is visible abroad: Japan's ten-year yield is at a 30-year high, the UK's is around its highest since 2008, and France's ten-year is at 5%.9
Firms are not the only ones borrowing heavily. Margin debt, money borrowed against investors' stock portfolios, hit a record $1.5tn in June.13 Assets in leveraged ETFs grew from about $110bn in late March to $220bn in June, much of it in chip stocks. These funds are built to return two or three times the daily move of whatever they track. On 5 June a triple-leveraged chip fund lost 31% in a single day.14
That brings us to the final pillar of the current situation: private credit. Even this secretive and opaque industry is showing strain. Loans made by investment funds instead of banks now carry a default rate of 6.3% according to Fitch, the highest the agency has recorded. Moody's looked at mid-sized borrowers and found a default rate of 4%. Counting loans whose deadlines were extended, or whose unpaid interest was added to the balance instead of being declared a default, the rate rises to 5.8%.15
So what do all of these numbers mean? We do not want to spread fear or claim that a crash is due next month. We are drawing attention to high prices, heavy borrowing, rising rates and strained lenders occurring at the same time. The alarming part is that earlier crashes needed only two or three of these. In the next section we look at those crashes and what set them off, and at how much of each is present today.
We look at five of the most prominent financial crises and ask what each one tells us about 2026.
After the Civil War, America built railways faster than it could use them. Track mileage roughly doubled between 1865 and 1873. The country did need the lines, but they were being built faster than they could be paid for.
Railway companies sold bonds to investors across Europe and the US, with bondholders in New York, London and Frankfurt, often long before the track they paid for existed. Jay Cooke, the American financier who had helped fund the Union side of the war, took on the Northern Pacific, a line meant to run from Minnesota to the Pacific, and tried to sell $100m of its bonds. There was not enough demand, and he could not sell them. Then the Vienna stock exchange crashed in May 1873, European money dried up, and he could not raise funds abroad either.
His firm, Jay Cooke & Company, closed on 18 September 1873. The banks that had lent against railway bonds went next. The New York Stock Exchange was forced to close for ten days, the first time in its history. In the end 121 railways failed, along with roughly 18,000 other businesses, and the depression that followed lasted more than five years.16
The railways themselves did not disappear. Other investors bought them out of bankruptcy and ran them for the next hundred years. The crucial point is that they bought them for a fraction of what the original investors had paid to build them.
Today's version of the story is data centres and neoclouds. The country may well need the infrastructure, but that does not mean the companies building it can survive until the investment pays off. In the railway story, the first investors lost everything and the second set enjoyed the profits for a century. Could this be a similar story? Only time will tell, but it looks like one.
It is no coincidence that we call the 1920s the roaring twenties: a new era of cars, radio, electricity and mass production. Stocks rose for most of the decade, and people bought them with 10% down and the rest on credit from their broker. By autumn 1929, brokers' loans had reached about $8.5bn, more than all the money in circulation in the United States.17
On top of that came the investment trusts, firms that owned shares in companies and in each other. Goldman Sachs Trading Corporation, a famous name even now, was set up in December 1928. It borrowed to buy shares, then launched two more trusts that borrowed to buy shares in the original one. A single dollar of actual stock ended up supporting several dollars of claims.
The Federal Reserve was worried about the speculation, and in August 1929 the New York Fed raised its lending rate to 6% to cool it down. On 3 September, a month after the measure, the Dow peaked at 381. In October brokers began issuing margin calls, asking investors for more money against their loans. The Dow fell nearly 13% on 28 October and about 12% the following day, and by mid-November it had lost about half its value. The problem for investors was not the fall in prices, which is a normal feature of any market; it was that around 9,000 banks failed between 1930 and 1933. The Dow bottomed in July 1932, down 89%.18 Goldman Sachs Trading Corporation went from $104 a share to under $2.
Now compare that with today: $1.5tn in margin debt, leveraged ETFs, AI companies funding each other's revenue, and a Fed raising rates into a market at record prices. Sound familiar?
In the early 1970s fund managers had the “Nifty Fifty”, a list of large growth companies thought to be too good to fail: companies whose shares you could buy and never sell. Polaroid, the camera maker, traded at 90x earnings, McDonald's and Disney at around 80x. Fifty times earnings was normal for the group. The market as a whole traded at 15x to 20x.19
There was very little borrowed money this time. The problem was the prices themselves, and then inflation put the last nail in the coffin. In October 1973 the Arab members of OPEC cut supply and the oil price quadrupled in a few months. US inflation rose above 12% in 1974 and the Fed took its main rate from 5.5% to 13%. No stock is safe at 90x earnings when government bonds pay 13%.
The S&P 500 fell 48% between January 1973 and October 1974, and far more once inflation is accounted for.20 Franklin National, then the twentieth-largest bank in America, failed in 1974. So did Germany's Bankhaus Herstatt, whose collapse froze the currency markets for days.
What made 1973 more serious than earlier crises is that the Fed could not help. A central bank cannot cut rates to rescue a market when oil has just quadrupled and inflation is in double digits.
Notice any similarities with today? The Iran war and Hormuz, energy prices up 20% in a single year, a handful of “too big to fail” names at the top of the S&P 500, and a Federal Reserve with its hands tied. Any forecast of a crash has to take this scenario into account.
This is the one most often compared to the AI boom. The internet story was true; the timing was not. In December 1999 the S&P 500 reached 44 times its cycle-adjusted earnings, higher than it has traded before or since.3
Once again the story was about debt, this time in telecommunications. Carriers borrowed heavily to lay fibre across the country and under the oceans, and to buy the equipment that ran on it. Lucent Technologies, the equipment maker that later merged with Alcatel, committed about $7bn in loans to its own customers so they could buy Lucent equipment.21 Does that sound familiar? Lucent's customers borrowed from Lucent to buy from Lucent; today Nvidia's customers are funded by Nvidia to buy from Nvidia. Nortel, Cisco and Alcatel did the same on a smaller scale. The industry called it vendor financing. Sales looked strong because the seller was lending the buyer the money.
Can you guess what happened right before the crash? The Fed raised rates from 4.75% to 6.5% between June 1999 and May 2000. The weakest borrowers went first. Carriers could not fill their networks, and only a small fraction of the fibre laid in the late 1990s was ever used. Global Crossing went bankrupt in January 2002 and WorldCom in July, at the time the largest bankruptcy in US history. Lucent's loans to its customers went bad along with the customers. The Nasdaq fell 78% from its peak and the S&P 500 fell 49%.20
The internet did eventually deliver the promised profits, and the fibre was used, but not by the companies that laid it. It was used by companies that picked it up for cents on the dollar after the crash.
Today's version: a CAPE (cyclically adjusted price-to-earnings ratio) of 40x against the dot-com peak's 44x, and AI companies funding the customers who buy their chips and cloud capacity, just as Lucent funded the carriers that bought its switches. On price, this crisis is the closest match.
This crisis needs little introduction, since it is probably the most studied crash of all. The story rests on the premise that house prices only go up, and that risk stops being dangerous once it is sliced up and spread around. Subprime mortgages were packaged into securities, and those securities were repackaged again and again. The result sat in SPVs off the banks' balance sheets. Hardly anyone traded these assets, so nobody knew what they were worth. The valuation of these mortgage-backed and asset-backed securities rested on a model.
The Fed had taken rates from 1% to 5.25% by June 2006. House prices turned later that year, and on 9 August 2007 BNP Paribas froze three of its funds. The stated reason was “the complete evaporation of liquidity” in parts of the US securitisation market, which made the assets impossible to value.22 In our view that was the true beginning of the crisis: the moment a major bank said in public that it could no longer price what it owned.
The instruments nobody could price went first, then the institutions that held them. Bear Stearns was sold in March 2008, Lehman Brothers failed that September, and the S&P 500 fell 57% between October 2007 and March 2009.20 In the end the government had to bail out the banks to save the system.
In 2026, the equivalent is private credit, where the funds that made the loans are the ones valuing them. When a borrower cannot pay, the loan is often extended rather than written down. Banks have lent around $300bn to these funds, and the hyperscalers keep their leases off the balance sheet. On paper, this is the closest match to the current situation.
Comparing these crises leaves us with a set of shared symptoms. Before drawing them together, one smaller episode is worth a look: 1987. On 19 October 1987 the Dow dropped 22.6% in a single day. There was no recession and no bank failure. The cause was portfolio insurance, a strategy that sold stock futures automatically as prices fell. The selling pushed prices lower, which set off more selling.
Leveraged ETFs do exactly the same thing today. They rebalance at every close, buying when the market rises and selling when it falls: an amplifier for any downturn. There is about $220bn in them. Put simply, it is the 1987 machine, rebuilt.
So when we put the five together, what do we have? 2026 has the debt-funded build-out of 1873, the leverage of 1929, the oil shock of 1973, prices close to those of 2000 and the hidden debt of 2008. No earlier crash had all five at once. Next we look at how they connect.
A fall in one sector is not, by itself, a financial crisis. It becomes one when the losses travel through debt into the institutions that hold it. Below is the path we think a crisis would most likely follow.
The first step is a fall in the AI and chip stocks at the top of the index. It would begin with a break: a hyperscaler cuts its spending plans, one of the large AI players misses a debt payment, or a quarter's results show revenue failing to keep pace with capex. The stocks, which together make up 39% of the index, would fall together.
Some cracks are already showing. The Nasdaq lost 5.3% in October and emerging markets outside China fell by about 10%. Intel was hit hardest, losing 30% in a single week.23 None of this amounts to a bear market; what we are seeing is investor doubt being priced in. In 2000 the Nasdaq peaked in March, but the telecom companies did not start failing until the following year.
Remember the number: $1.4tn of spending promised by smaller AI companies to the firms that back them. When stock prices fall and lenders pull back, these smaller firms have no choice. Their commitments are renegotiated or cancelled, and the revenue the large firms were counting on shrinks as AI start-ups disappear. Because that revenue was partly funded by the large firms themselves, the loss hits twice: once as a write-down on the investment, and once as a hole in future sales. This is the 1929 trusts and Lucent's customer loans all over again.
Next the bond market moves, and it moves faster than the stock market. The weakest borrowers go first: the neoclouds, then Oracle, then anyone whose debt was issued on the assumption of never-ending AI demand. CoreWeave's bonds already yield more than 15%. Insurance against a default by Oracle or Broadcom is priced close to junk levels, and the amount of credit protection outstanding on large tech names is at a record. Investors are clearly uncertain.
Another problem with AI debt is how much of it sits inside the large bond indices. AI-related debt is now the largest single sector in JPMorgan's US investment-grade index, at about 14%, ahead of banks.6 If and when the sector reprices, every fund that tracks that index sells with it. The dot-com bubble worked the same way: telecom bonds had become the largest sector in the high-yield index.
As we noted above, private credit is a secretive and lightly monitored space, and it has lent enormous sums to AI companies. These funds hold loans to AI data centre projects, to the companies that supply them, and to the mid-sized firms that make up most of their books. The chain works until public bond markets fall far enough that the gap between what a fund says its loans are worth and what the market would pay becomes impossible to defend.
The pressure is starting to show. Fitch's default rate is at a record 6.3%. Moody's finds that counting extensions and unpaid interest adds nearly two points to the headline number.15 Some retail-facing funds are receiving more redemption requests than they can meet. The next step is the gate, when a fund stops paying investors out. In our case studies, this is BNP Paribas in 2007, freezing three of its funds.
Banks are not supposed to be exposed to this chain. In practice they are. US banks have lent almost $300bn to private credit funds, which in turn lend to AI companies, so a loss in those funds is a loss on a bank's balance sheet. Deutsche Bank, Europe's eighth-largest bank, disclosed $30bn of private credit exposure in March this year. The Federal Reserve has asked US banks to disclose their exposures, presumably to gauge the potential damage.24 The IMF's stress test found that banks holding 22% of global banking assets would fall below their minimum capital requirements in a downside scenario, up from 18% a year earlier.8 There is a pattern of over-lending here, and it is poorly disclosed: lending through private credit does not show up as AI exposure on a bank's books, so it hides how much a bank stands to lose if the AI market turns.
This is how, in 2008, failing securities reached the institutions, and how, in 1873, the damage moved from railway bonds to the banks that held them.
Investors treat Treasuries as the safest asset because in every crisis since 2008 they have risen when everything else fell. That is no longer guaranteed. Hedge funds hold very large leveraged positions in Treasuries, borrowing short-term to buy the bonds and selling futures against them. When their lenders demand more collateral in a stressed market, they sell the bonds. That is exactly what sent Treasury yields up in March 2020 while the stock market fell, and the Fed had to buy more than $1tn of bonds to stop it. The IMF devoted a chapter of its October report to the same risk today, with the positions significantly larger than they were then.8
In this chain, long-term yields go up during the crash rather than down. The ten-year US yield is already above 5%. A forced unwinding of hedge fund positions, on top of a $2tn deficit and a Fed that is still raising rates, pushes it higher still. And the higher the discount rate, the less future earnings are worth today, which pulls stock prices down again and sends us back to the first link.
The chain above has run before, and each time the Fed stopped it: in 2001 inflation was below 3%, and in 2008 it collapsed along with oil, so the Fed could cut. In November 2026 core inflation is 3.0%, headline inflation is 3.7%, and energy prices are up by at least 20% in a single year. The Federal Reserve has raised rates and has two of its governors asking for higher ones. That leaves it with two bad options. If it cuts rates to stop a market fall, it does so with inflation at 3.7% and oil above $100. That is what the Fed did in 1973, and the result was inflation that lasted the rest of the decade. If it keeps rates high, nothing stops the seven steps above from running one after another.
That is the main difference between 2026 and the last two crashes. The links in the chain are the same, but the Fed's safety net is not there.
Everything above could be wrong. Many professionals and researchers believe the AI boom will keep going, and to be fair we should set out their case properly. Below are the five strongest arguments against a crash, and, more importantly, where each one stops working.
On paper, the balance sheets of the top AI companies are very strong. In 2000 the companies at the top of the index were borrowing to survive; that is not the case now. According to FactSet, four of the five largest hyperscalers have debt equal to a year of operating profit or less.5 Put simply, Microsoft and Alphabet could pay everything off in roughly a year of earnings. WorldCom could not.
This holds only if we leave out the leases. Hyperscalers increasingly rent their data centres rather than own them, and a long-term lease is debt under another name. It also says nothing about the rest of the chain. Oracle, CoreWeave and the private credit funds do not have those balance sheets, and the break, we argue, starts with one of them, not with Microsoft.
The ten largest companies make up 39% of the S&P 500, and they generate about 38% of its profit. That was not the case in 2000, when the largest companies were valued on hope rather than income. Today's concentration reflects the fact that a few companies make most of the money.
Where the argument stops is that those profits depend on the spending cycle continuing. Nvidia earns its margin because the hyperscalers keep buying chips. The hyperscalers keep buying as long as their revenue keeps growing. But part of that revenue, as we saw in Section I, comes from companies they fund themselves. The earnings are real today; whether they are still real once capex slows is the question the market has not answered.
What is different from 2008 is that there is no household debt bubble. Back then ordinary people had borrowed heavily against houses they could not afford, and lenders had passed the loans on under the originate-to-distribute model, so when house prices fell the losses went straight into the banking system and from there to every intermediary. That is not the case now: house prices are high, but mortgage lending standards have been tight since 2010.
The argument stops because the debt did not disappear. It moved. In 2008 it sat with households; now it sits with companies, private credit funds and hedge funds holding leveraged Treasury positions. The danger is that the scale of the problem is far less visible than household debt was.
Since the stricter capital requirements of Basel III were introduced after 2008, banks have had to hold far more capital than before, and they are stress-tested every year. A repeat of Lehman Brothers is highly unlikely.
But the risk has moved out of the banks and into non-bank intermediaries that regulators do not stress-test. These intermediaries hold the leverage that banks no longer can. And the banks are still involved: $300bn lent to private credit funds. As noted earlier, banks holding 22% of global banking assets would fall short of capital in a severe scenario.
For government bonds the story is very different from the years after 2008, when they paid nothing after inflation and investors bought stocks because there was no alternative. That is no longer the case: the ten-year Treasury pays 2.6% above inflation. One could argue that money now has somewhere safe to go, which in theory should make the financial system more stable.
In our chain, though, this is not a defence; it is the problem. The reason stocks look expensive is precisely that government bonds pay again. When the safe asset pays well enough compared with the risky one, the money eventually moves. It has not moved yet.
All five arguments hold, and all five are about the strongest parts of the financial system: the largest banks, the largest companies and households. None of them covers the smaller entities: the neoclouds, the private credit funds, the leases, the hedge funds. The system is stronger at the centre than it was in 2008. It is weaker at the edges, and that is where a crash would begin.
No matter how sophisticated the analysis, nobody can predict the future, and the details least of all. What we can do is set out the ways a blow-out could happen, say which we think most likely, and give a list of things to watch.
Prices drift down over a year or two while earnings slowly catch up. Hyperscalers trim their spending plans, the weakest AI companies quietly go under or are bought, and the index gives back 20-25% without anything in the financial system breaking.
This happened as recently as 2022, when the S&P 500 fell 25% and the Nasdaq 33%. It was driven by the fastest rate hikes in forty years, and the market recovered within two years. This is what most Wall Street strategists expect, and it has the strongest base rate: most expensive markets deflate rather than crash. We give the slow decay a 35% chance.
The scenario is simple: one large AI borrower fails. A neocloud misses a payment, a data centre project cannot refinance, or a private credit fund gates withdrawals. The market then asks what everything else of the same kind is worth, and the answer is far less than the funds have been saying. Private credit marks reset, bank exposures surface, and the loss spreads through the sector.
This is the 2007-08 story with a different asset. Stocks would fall 35-50%, banks would need rescuing and the recession would be severe. We put the private credit event at about 30%.
A weak Treasury auction, or a forced sell-off by hedge funds, sends the ten-year yield towards 6%. Stocks and bonds fall together, as they did in 2022, and there is no safe asset to hide in. The damage comes less from any one borrower than from the fact that every asset on the planet is priced off the Treasury yield.
The comparison is 1994, or the UK in autumn 2022 on a larger scale. We put the rates shock at about 20%.
The Iran war keeps oil above $100 and inflation near 4%. Since there is little a central bank can do about an oil shock, the Fed keeps rates high for years. There is no formal crash, but no recovery either. Stocks fall 30-40% over several years and lose far more after inflation. This is 1973-74 and the decade that followed. We put the stagflation grind at 15%.
We expect a credit event. We also think it will push the ten-year yield higher, so Path 2 may well set off Path 3.
A slow decline is the most likely single outcome. But we are not calling it, for two reasons. First, a credit event causes far more damage than the other paths, because of the hidden exposure of other intermediaries. Second, the credit event has already started and the others have not. CoreWeave pays more than 15% on its debt. Private credit defaults have never been higher. Banks have lent $300bn to funds that set their own asset prices.
A slow decline requires the credit system to stay intact while stock prices fall. It did not in 2000: the Nasdaq fell for two years and the telecom bankruptcies came in the middle. It did not in 2007: the market peaked in October, two months after BNP Paribas had frozen its funds. In both cases the first months looked like a slow decline. They were not.
The break will start in debt that is priced by the people who own it: neocloud bonds, private credit loans, data centre leases. Stocks will follow. With inflation at 3.7%, the Fed will not cut rates to stop them.
In 1929 the Federal Reserve raised rates to stop speculation. It ended up fighting the economy instead, and the decade that followed carries its name. In 2026 the Federal Reserve is raising rates to stop inflation. It may end up in the same place.
The next crash will not start where people are watching. It will start where the debt is valued on a model.
