Why Smart Investors Make Bad Decisions: A Behavioural Approach to Investing.
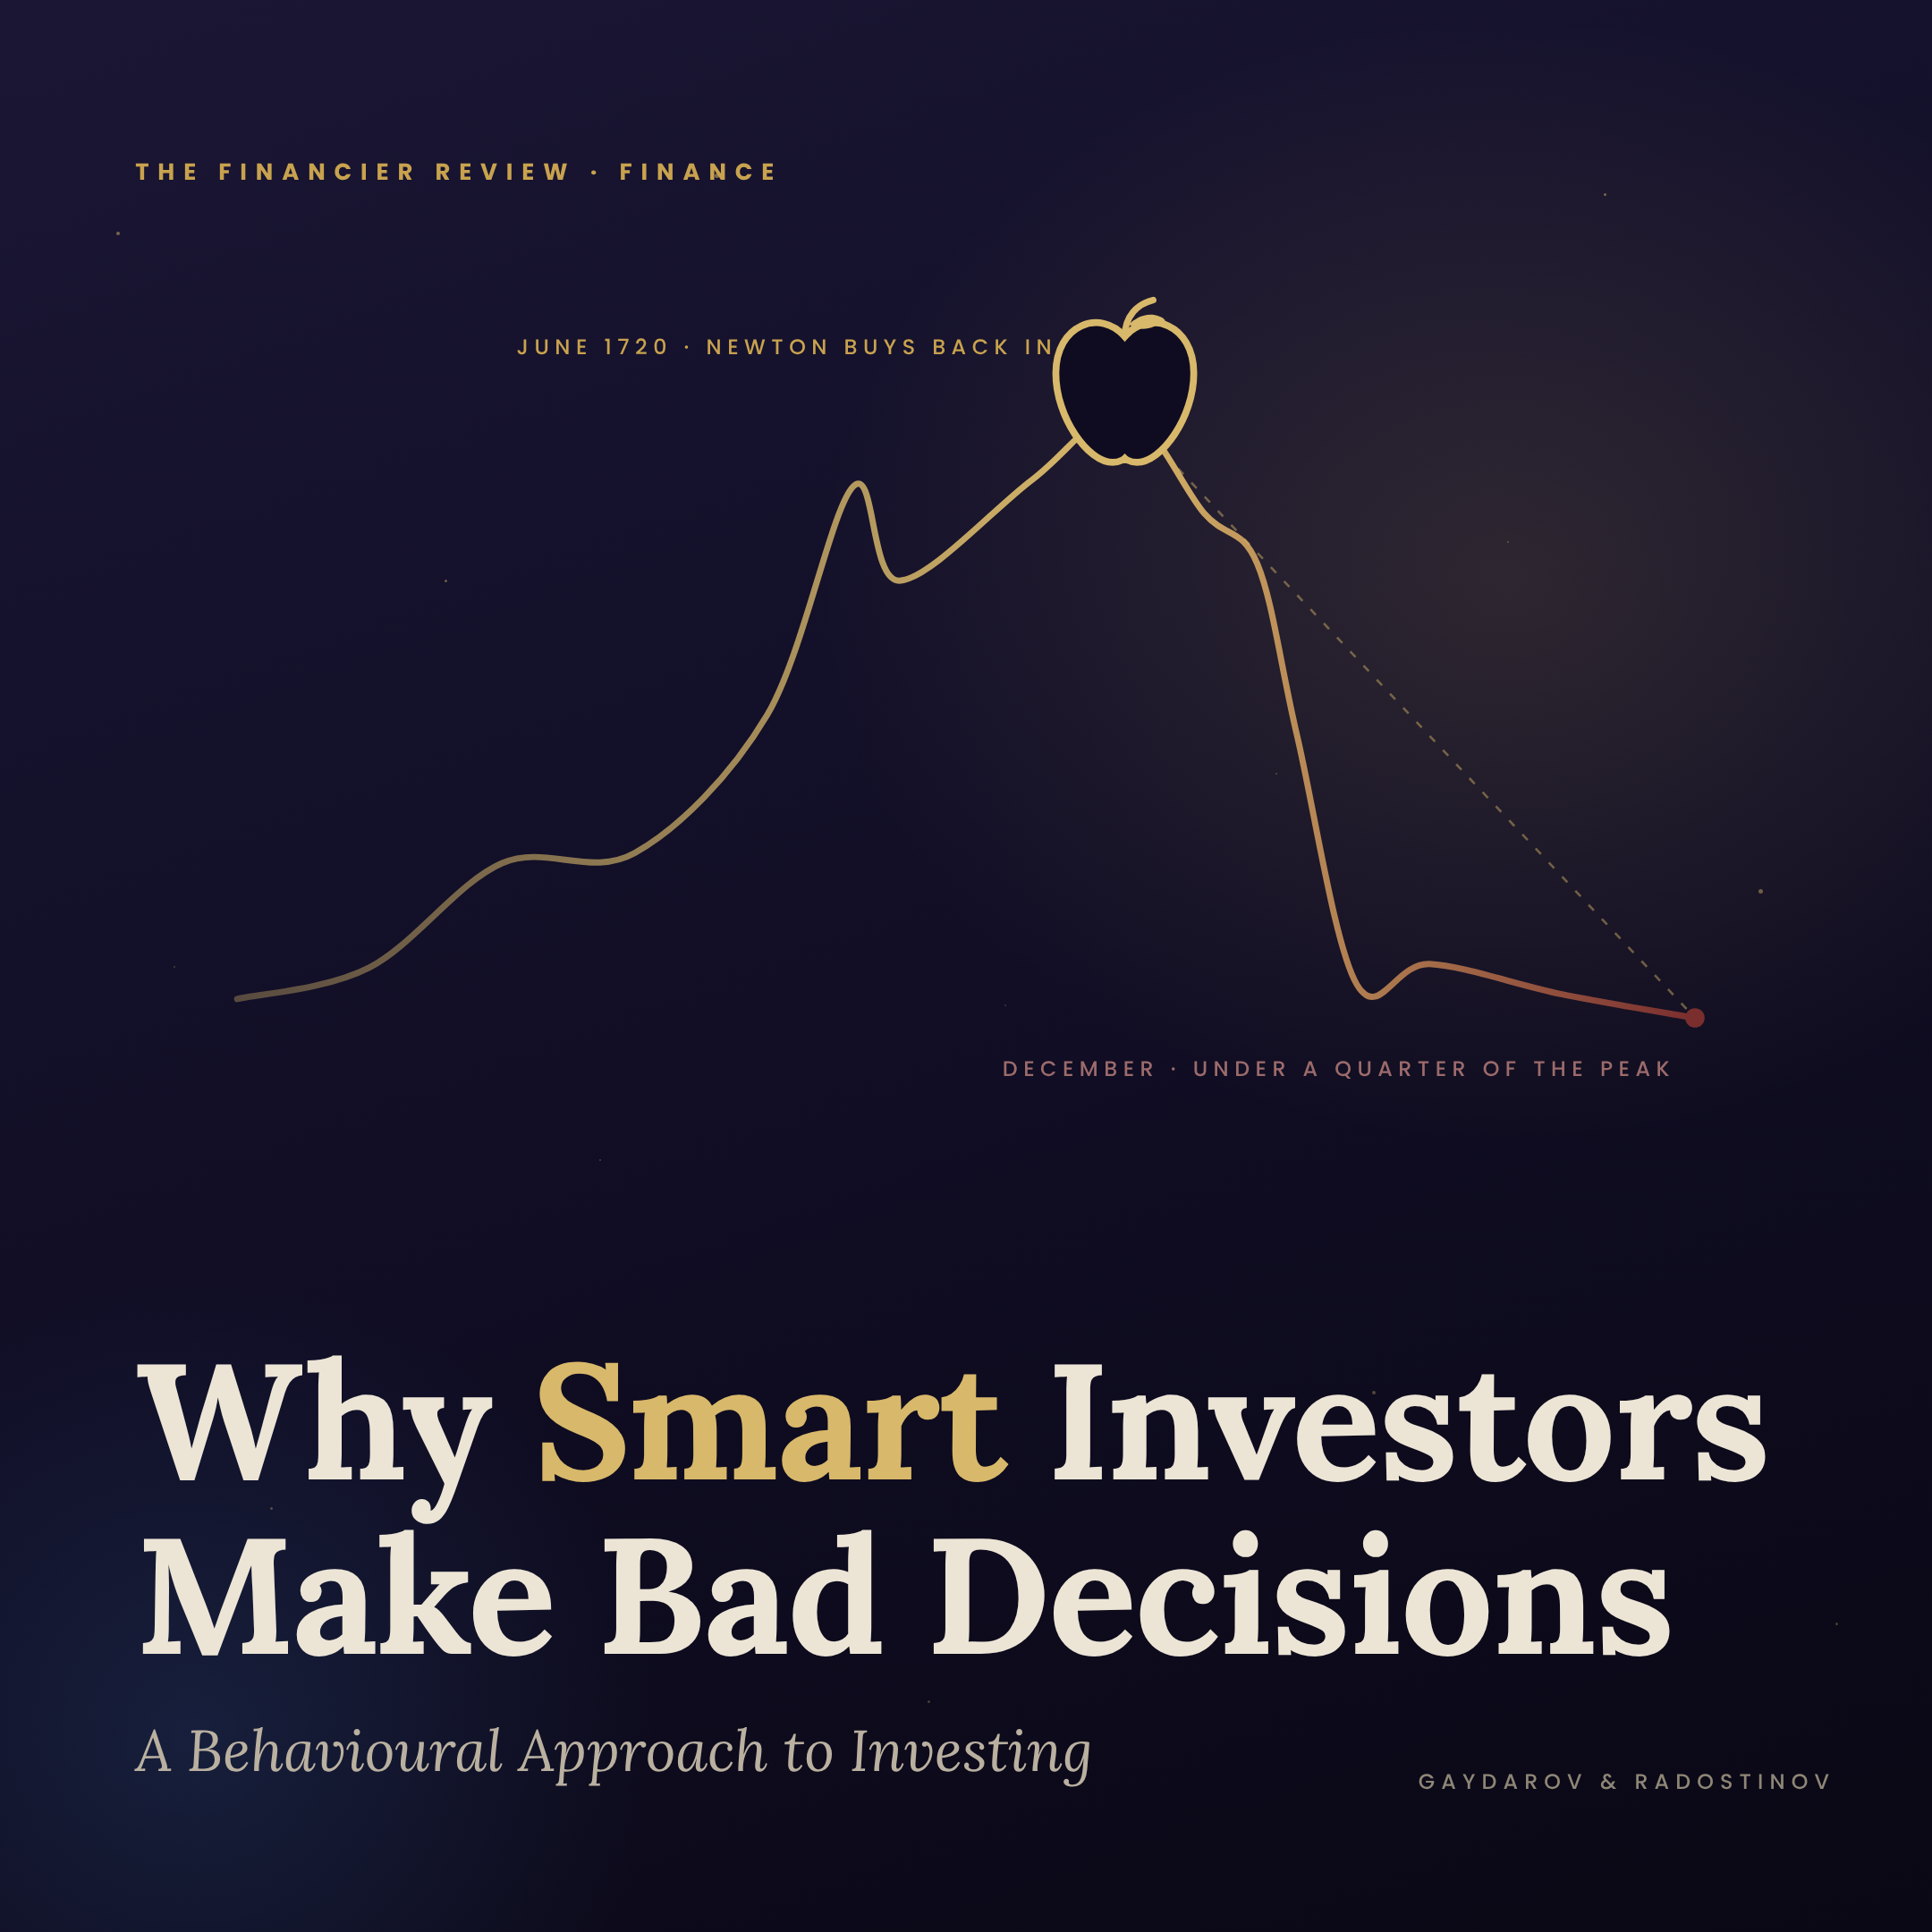
in England Lost a Fortune
You are probably asking yourself if the heading claim is true, and the answer would be yes. In 1720, Sir Isaac Newton bought shares in a company that gained traction and popularity. The name of that company was the South Sea Company, whose main operations revolved around lowering government debt, which had hit record highs following Britain’s war with Spain. He watched the stock price rise, and he sold his stock in April for a very healthy profit. But the effects of watching a stock continue to grow and not being included in that growth materialise quickly into poor actions. By June the scientist was back in, at nearly three times the original share price. Just a few months later the bubble burst, and the man who had written the laws of motion lost £20,000, or the equivalent of several million pounds in today's money. So one of the world’s brightest minds at the time calculated the movements of the heavenly bodies, but not the madness of Britain’s society.
Well, two and a half centuries of financial theory later, the exact same framework happened again with the two people who wrote it. A firm by the name of Long-Term Capital Management opened for operations in 1994, with two future Nobel laureates on its board, and some of the most sophisticated quantitative modelling ever brought to a trading game. For four years, it seemed like the models were doing amazingly well. But in 1998 the fund lost a staggering $4.6 billion in the span of a few months and had to be bailed out by a consortium of banks in order to contain the damage that their overconfidence caused within the financial sector.
And an important distinction to be made here is that neither of the two stories is about ignorance. Newton wasn’t some naive speculator who just wanted to join the ride for a free profit, and LTCM’s Nobel Prize-winning partners, Myron Scholes and Robert Merton, understood the concept of risk in a financial market better than arguably anybody on the planet. Both of these scenarios were caused by something that is intrinsic and not written in numbers or spreadsheets. It is the way the human mind behaves when its own asset is on the line.
The investing errors that cost people the most are not errors of knowledge or misunderstanding. They are of a psychological nature, and intelligence offers almost zero protection against them.
Among the behavioural biases, “framing” is of paramount importance. Most commonly, the concept of framing can be interpreted as the process of forming a perception of a decision problem, based on the way in which the relevant information is presented, rather than on its actual content (Glaser et al., 2007). Traditional finance is built upon the assumption of frame independence and transparency, according to which decision makers are able to see through the different ways in which the same investment decision may be described (Nofsinger, 2026).
However, behavioural finance challenges this assumption by indicating that perceptions are highly influenced by the way decision problems are framed. In this sense, individuals are defined as frame dependent, since framing in practice is opaque rather than transparent. As a result, individuals often have difficulties seeing through an opaque frame, making their decisions typically depending on the particular form in which the problem is presented.
This phenomenon finds its particular relevance in the risk/return relationship, which is considered the most fundamental principle in finance. While asset pricing models such as CAPM and APT measure risk in different ways, relying either on fundamental or on macroeconomic data, all of them require a risk premium to be associated with risk. For example, firm characteristics such as higher leverage or poor growth prospects are associated with higher risk.
However, experts argue that framing influences investors who understand this relationship frequently fail to apply it, when the situation is framed not within a risk/return context, but a different frame is used (Nofsinger, 2026). As a result, they fail to properly evaluate the risk premium and neglect this relationship, adopting a “better/worst” frame instead. Under this frame, better stocks are perceived as having higher returns and low risk, while worst stocks are associated with low returns and high risk. Since the “better/worst frame” does not describe the risk/return relationship accurately, investors often take more risk than they are aware of.
In addition, the effect of framing can also be observed in the way investors form their forecasts (Glaser et al., 2007). If we assume that a certain stock market index has risen from 5,000 to 6,000 points over the last year, this development can be described in two ways – either as a 20% return or as an increase in the level of the index by 1,000 points.
Although both descriptions contain exactly the same information, investors tend to react differently depending on which one they are presented with. When asked what return the index will achieve at the end of this year, investors focus on the 20% growth and are therefore inclined to expect a similarly positive return, thus extending the current trend. On the contrary, when asked what level the index will reach this year, investors focus on the level of 6,000 points, they tend to be more inclined to expect a stagnation or a decline back towards it, interpreted as a belief in mean reversion. This leads to the conclusion that even the format in which a forecast is requested can alter investors’ expectations, as outlooks based on return forecasts are biased toward extending the current trend, whereas outlooks based on price forecasts tend toward a belief in mean reversion.
Framing is also closely related to “mental accounting” - the process by which people code, categorise and evaluate economic outcomes (Nofsinger, 2026). People mentally frame assets as belonging to either current income, current wealth or future income, placing each investment into a separate mental account. As a result, each investment is treated separately while the interactions between investments are overlooked, which limits investors’ ability to minimise risk and maximise return through a portfolio approach.
In addition, this mental process can affect an investor’s wealth, unconsciously influencing investors to avoid selling stocks with losses, since closing the mental account at a loss triggers the emotional pain of regret (Nofsinger, 2026). However, as time passes, the purchase of a stock becomes a sunk cost and the emotional pain associated with it diminishes, which makes it less distressing for the investor to sell the losing stock later as opposed to earlier. For the same reasoning, when investors decide to sell losers, they tend to bundle more than one sale on the same day, thus aggregating the losses and limiting the feeling of regret to one time period.
The practical implications of mental accounting can be further highlighted through the concept of “magic selling words”. In his stockbroker manual, Gross (1982) argues that investors prefer some frames to others, a principle known as “hedonic editing”. According to him, the words with the greatest power to facilitate the acceptance of a loss are “transfer your assets”, since they induce the client to reallocate assets from one mental account to another rather than to close a mental account at a loss. In other words, the effectiveness of this phrase lies in the fact that it reframes the problem.
In order to understand why intelligence does not necessarily protect investors against poor decision-making, it is essential to consider the way in which judgements are formed. Human thinking can be differentiated into two modes - System 1, which is fast, automatic and intuitive, and System 2, which is slow, deliberate and effortful (Kahneman, 2011). It has been identified that most biases arise because System 1 generates an answer, which a “lazy” System 2 then endorses without checking it, while people tend to build confident stories on the basis of limited information.
The way in which System 1 evaluates risky outcomes can be explained through prospect theory, which can be interpreted as a descriptive alternative to expected utility theory (Nofsinger, 2026). Instead of evaluating outcomes in terms of final wealth, individuals assess them as gains and losses relative to a reference point. These are valued through a function that is concave for gains, convex for losses and steeper for losses than for gains, while small probabilities are overweighted and moderate or high probabilities are underweighted (Kahneman and Tversky, 1979). As a result, people overweight sure outcomes and ignore the common components of choices. Moreover, they are risk-averse when facing gains, but risk-seeking when facing losses. Subsequent refinements of the theory have further quantified this asymmetry. They estimate a loss-aversion coefficient of λ = 2.25, meaning that a loss weighs roughly twice as much as a gain of equal magnitude (Tversky and Kahneman, 1992).
Nevertheless, it could be argued that individuals who are aware of these tendencies should be able to correct them. However, the evidence on the so-called “bias blind spot” suggests otherwise (Pronin, Lin and Ross, 2002). People readily recognise biases in others while believing that they themselves are less susceptible to them, rating themselves as less prone to a range of cognitive and motivational biases than both the average person and their peers. Even when informed about a bias that had just affected them, many still deny that it influenced their own judgement. This leads to the conclusion that knowing about biases does not by itself remove them.
Let’s do a fun experiment to dive into how overconfidence is investing’s biggest enemy. Ask a room full of drivers whether they are better than the average driver and most people will say yes. In a well-known study conducted in 1981, Ola Svenson asked American students to rate their driving abilities against the rest of the room. 93% placed themselves in the top half in terms of skill. The normal distribution of a random variable does not allow it, but the feeling is universal, and it survives most contact with evidence. If we were to conduct the same experiment with portfolio managers and stockbrokers we would receive the same results.
This overconfidence is crucial because, as with everything on financial markets, it has a price. It shows up on a brokerage statement as activity. If an investor believes that they can see what the rest of the market cannot, every trade has a cost. These costs materialise as transaction commissions, the spread between the bid and the ask, the tax they have to pay on capital gains from a realised gain. Brad Barber and Terrance Odean gave numbers for this trading through recording 66,465 US households and their trading habits over a period of six years. A directly proportional relationship was observed: the fewer trades you made, the more likely you were to earn what the market earned. Those who traded the most earned a mere 11.4% per year, over six percentage points off the market’s 17.9% (Barber & Odean, 2000). The stocks they picked did not outperform the stocks they sold, and they simply paid repeatedly for the privilege to change their minds.
A follow-up study was conducted, which revealed even more of the same phenomenon. When we compare men and women on the trading ground, with the same data, on average a man traded 45% more often than a woman, which implied a higher trading cost equating to a point a year more than for females (Barber & Odean, 2001). And the difference wasn’t due to skill levels; stocks picked by men weren’t worse. It was in how sure they were about their choice.
If we push this theory of transactions causing a difference further, the image gets even clearer. Another study, this one related to the entire Taiwanese stock market found that individual investors lose about 3.8% a year just to trading, which is a sum equalling 2% of the country’s GDP, and all transferred in fees and other auxiliary payments to institutions and the exchange (Barber, Lee, Liu & Odean, 2009). If we look at day-trading the picture is even more grim. In Brazil, over a period of no less than 300 days, 97% of day traders lost money, and less than 1% earned more than the local minimum wage (Chague, De-Losso & Giovannetti, 2020).
Therefore, the pattern we observe is the same at every scale, no matter the category. The more certain an investor is, the more they trade. And the more they trade, the more they pay for their shifting views. So, we call it The Confidence Tax: on Barber and Odean’s numbers, somewhere between 2 and 6 points a year for the most active, levied not by the government but by the investor on themselves.
Since we saw just how costly the Confidence Tax is to an investor, we can address the other elephant in the room. Picture two stocks in your portfolio. When you were buying them, the price per share was €100, and in a matter of a few months one went to €130 and the other to €70. But all of a sudden you need to raise some cash and you must sell one of your shares. Most people would sell the winner, and psychologically it feels like a great deal. Selling the loser, meanwhile, implies that you made a mistake, and that €30 difference is admitting the mistake. But if you keep the shares, there remains a possibility that it was never a mistake at all, as on paper the loss is not yet real.
This phenomenon is called the disposition effect, named by Hersh Shefrin and Meir Statman who argued that investors are not managing portfolios so much as a set of mental accounts, each opened at the purchase price and closed only when it can be closed as a win (Shefrin & Statman, 1985). What drives this investing bias is loss aversion. Research suggests that the psychological effect of a loss is twice as bad as a win (Tversky & Kahneman, 1992), so the investor pays to avoid making it official.
Professor Terrance Odean tested this on 10,000 brokerage accounts and found that in any given year, investors realised 14.8% of their available gains, but just 9.8% of their available losses. A winner was about half as likely again to be sold as a loser (Odean, 1998). And this habit wouldn’t be a problem if the winners were overvalued and the losers pending a rebound. The issue is that neither of these categories was. Winners that were sold went on to outperform the losers that were kept by about 3.4 percentage points in the following year. In other words, investors were trimming off the strong positions and watering the weak ones. Another weak point of this habit is the tax code in almost all major financialised economies. Investors were realising taxable gains while sitting on deductible losses. And this same result holds even when there is no additional information. In a simulated test, Martin Weber and Colin Camerer gave students six invented assets whose prices moved at random, with the odds printed in front of them, so there was no story to believe in and no company to be loyal to. The students still sold the assets that had risen and held the ones that were at a loss (Weber & Camerer, 1998).
Additionally, we can identify another cost of loss aversion that has nothing to do with the act of selling itself. It is dependent on how often you check the performance of your portfolio. Since 1928, the S&P 500 has risen on only 53% of trading days, so an investor who checks the markets daily sees red almost every other day. If we extend the horizon, it is up about 62% of the time monthly and 74% for a calendar year. Therefore, the losses do not disappear, but the number of times an investor has to take the psychological damage of a loss falls as they step away from the screen. Shlomo Benartzi and Richard Thaler argued that this alone is an explanation as to why investors demand such a large premium to hold equities. The average investor behaves as if they are evaluating their portfolio once a year, while in practice the psychological pain from their losses pushes them towards cash and bonds, which return significantly less than stocks (Benartzi & Thaler, 1995).
So when we combine these two loss aversion practices, they charge an investor twice. They make them sell the positions they should keep, at a cost of about 3 points a year on the gap between what they sold and held. Furthermore, it makes them hold less risk than they can afford, for the sake of not seeing a loss that is inevitable.
A key role in the irrational behaviour of investors is played by the self-attribution bias, also referred to as self-serving attribution bias, which describes the tendency to attribute successful outcomes to skill and unsuccessful outcomes to bad luck or outside events (Nofsinger, 2026). A typical manifestation of this bias is the “lucky fool” syndrome among market traders, seen as attributing skill to randomness - investors who experience a run of successful results develop an inflated opinion of their own skills, which may result in exaggerated risk taking.
Fund managers, investment analysts and company chairmen appear to be particularly prone to this bias. For example, analysts who perform well for a period tend to follow with predictions that have greater errors, while chairmen’s letters to shareholders often demonstrate “self-serving” managerial behaviour, where credit is taken for favourable outcomes and poor performance is blamed on the external environment (Wang, 2024). Similar patterns can be observed among fund managers who blame the government rather than their own investment judgement for their losses, as well as among internet stock traders who blame the market and online trading platforms.
Self-attribution bias is closely connected to overconfidence, which manifests itself through two main illusions - the illusion of knowledge and the illusion of control (Nofsinger, 2026). On one hand, the illusion of knowledge suggests that the more information individuals have, the more confident they become. However, individual investors often lack the training and experience required to interpret this information, and thus less-experienced investors achieve lower returns when relying on unfiltered information.
On the other hand, the illusion of control refers to the belief that individuals have influence over the outcome of random events. In this regard, people become more overconfident the more time they spend analysing a situation and the longer their run of prior successful outcomes was (Nofsinger, 2026). Therefore, they are prone to trading too frequently, choosing riskier stocks and underestimating the risks they take, mistakes which ultimately erode their returns.
Investors frame their choices in terms of potential gains and losses relative to a specific reference point, and although various reference points can be observed, the purchase price appears to be particularly important. However, beyond such cognitive anchors investment decisions are also shaped by emotions such as regret, which is closely related to loss aversion (Nofsinger, 2026). The pain of losing is not only due to the financial loss, but also to the associated emotions of guilt, regret and shame.
Regret can be identified as the emotion experienced for not having made the right decision, associated with feeling responsible for the loss (Nofsinger, 2026). The feeling of regret tends to be particularly intense when a better outcome can easily be imagined, or when the individual bears sole responsibility for a decision that turns out badly, rather than being able to share it with others.
Consequently, investors often seek to minimise their anticipated future regret, even at the expense of an optimal risk-return trade-off. Regret minimisation also leads some investors to use dividends instead of selling stocks to finance consumer expenditures. Additionally, individuals use many different unconscious strategies against bearing loss, including denial, blame, rationalisation and hope.
Closely related to regret is also the hindsight bias or the “I-knew-it-all-along” effect (Nofsinger, 2026). Once the outcome of an event is known, individuals are unable to go back in time, and this outcome awareness increases their belief that the event was inevitable or predictable in foresight. Thus, people remember inflated prior probabilities for events that actually occur and vice versa, as the prior probability is adjusted towards the posterior probability.
Moreover, since previously stored memories tend to be overwritten, it becomes difficult to reconstruct past experiences, and subjects tend to remember their correct predictions as having been stronger than they actually were (Nofsinger, 2026). As a result, other people’s past decisions may look wrong, even though they were perfectly reasonable given the information available at the time. In financial markets, analysts may believe that they already knew a company was a good investment once its share price has risen, while fund managers recognise that they “are” in a bull market only after the index has increased continuously for a long period of time.
Beyond psychological explanations, recent research in neuroscience and physiology suggests that the aforementioned irrationalities and errors in judgement also have a physical basis. It has been examined that brain imaging of individuals choosing between risky stocks and a riskless bond shows that activation of the nucleus accumbens, a region associated with reward anticipation, precedes risky choices and risk-seeking mistakes (Kuhnen and Knutson, 2005). In contrast, activation of the anterior insula, which is linked to the anticipation of losses, precedes riskless choices and risk-averse mistakes.
Similar patterns can be observed in the hormonal responses of professional traders. It was observed that morning testosterone levels were higher on days when traders made above-average profits, while cortisol increased with the variance of their results and with market volatility (Coates and Herbert, 2008). Moreover, testosterone may fuel risk-taking in bull markets, whereas cortisol may promote risk aversion in volatile markets, thus amplifying market swings.
Additionally, physiological signals such as skin conductance and heart rate show significant responses to market events, including price deviations, trend reversals and volatility (Lo and Repin, 2002). Even experienced traders display such emotional responses, although less experienced traders react more strongly.
The most striking evidence, however, comes from a repeated investment game, conducted in 2005 by Baba Shiv, George Loewenstein, Antoine Bechara, Hanna Damasio and Antonio Damasio, which compared patients with lesions in emotion-related brain regions to healthy participants (Shiv et al., 2005). In each round, participants could invest $1 on a coin toss, either losing the $1 or winning $2.50, so that investing in every round had a positive expected value. It has been discovered that patients with lesions in emotion-related brain regions invested in more rounds and ended up with more money, whereas healthy participants became more conservative after losses, even though this was suboptimal. Additionally, regret appears to have a measurable neural signature - a regret signal in reward-related brain regions follows seeing a previously sold stock rise and predicts the reluctance to repurchase it.
Another important aspect of the financial biases is the confirmation bias - the tendency of people to favour information that confirms their hypothesis, regardless of whether this information is true (Nofsinger, 2026). As the physicist Robert Park (Wall Street Journal, 1999) points out, this is often not deliberate fraud, since people are “awfully good at fooling themselves”. As a result, individuals gather evidence and recall information from memory selectively and interpret it in a biased way, seeing what they want to see and searching for evidence consistent with previously held views, while neglecting potentially disconfirming information. Additionally, consensus itself becomes confirmatory evidence, and redundancy of inputs may decrease decision quality while increasing confidence, as illustrated by the tendency of analysts to work with several different profit measures when judging company performance.
In the context of financial markets, confirmation bias suggests that investors are more likely to look for information that supports their original investment idea rather than to seek out information that contradicts it (Nofsinger, 2026). As a result, one-sided information tends to skew investors’ frame of reference, leaving them with an incomplete picture of the situation and often resulting in faulty decision making. For example, an investor who hears about a “hot stock” from an unverified source and is intrigued by the potential returns might research the stock only in order to prove that its potential is real. Therefore, actively searching for disconfirming evidence can be highlighted as crucial for obtaining an objective view of an investment.
So, what can we conclude and what practical implications can we receive from the psychological mistakes we make? Trading too much costs the most active investors 2-6 points of return per year, and selling the wrong stocks costs about 3 points more. Plus, buying what the rest of the crowd is buying costs a few more points per year. Not everyone pays every charge, but Morningstar, which measures the gap between what funds return and what their investors earn, finds investors trailing their own funds by 1.2 points a year, with the timing of their own decisions as the only explanation (Morningstar, 2026). Over a working life that is more than a quarter of the final portfolio.
The obvious response here would be to try harder, but evidence suggests that even attempting to be more rational doesn’t always work. Newton was foolish in April and bought back in by June. Weber and Camerer’s students were even told the exact odds, and they still sold the winners anyway. We make these decisions long before knowledge becomes a factor.
To beat this predisposition towards cognitive mistakes, we have to remove the decision itself. Thaler and Benartzi asked employees to commit in advance to raising their pension contributions, following each future pay rise, and contribution rates nearly quadrupled from 3.5% to 13.6% of their salary, during a period of three years. The simple explanation behind this occurrence is: nobody ever felt damage to their take-home pay (Thaler & Benartzi, 2004). When a US employer switched its retirement plan from opt-in to opt-out, new hire enrolment jumped from 37% to 86% (Madrian & Shea, 2001). When a decision is already made for you (in our case, opt-out means that by default you are enrolled to contribute to your pension fund), you are far less likely to opt out, and vice versa for opt-in. And all this success is owed to a default decision that seems to always beat willpower.
Therefore, for the individual investor we can deduce three rules. Always decide in advance what you invest in, and before you commit, give yourself a written account of why you decided to choose this stock. Because when the stock inevitably falls 30%, you have written hard rules on when and why you would sell.
Further, automation is an excellent way to remove the confidence tax, by investing a fixed sum of money into a diversified fund each month. This procedure helps because there is no decision to be confident about. And finally, the less you look, the more risk you can tolerate, and consequently the more return you receive (Thaler, Tversky, Kahneman & Schwartz, 1997). A portfolio checked once a quarter shows a loss a third of the time, while one checked daily shows a loss almost every other day, and nothing about the portfolio truly changed - just the likelihood of you selling a winning stock.
The truth is that none of this makes the market easy to beat, and some anomalies do look weaker when re-examined, but the claim we have is far more essential. The average investor does not need to beat the market, but to stop paying to lose to it.