The Greatest Trade No One is Awake For.
Imagine we have two investors which hold an index for a set period. The only difference between these two investors is the trading style and when they buy/sell. Investor 1 buys ETFs and holds them only overnight. When the market is about to close, he opens a position and just as the market is opening, they close their position. The collection of this investor is the delta of the market stock while exchanges were in the dark.
On the contrast side of our experiment, we have Investor 2, who invests only during the day – essentially the exact opposite of the previous player. They buy when the market opens and sells when the close bell rings. Each night they sit on their cash pile until the next trading day. Combined, both investors cover the entirety of the day. Neither of them beat the other to the market, time the market or conduct any special activities – they simply divide the stock between the night and the day.
In about two decades, the overnight investors turns one dollar, invested in the Nasdaq 100 into roughly 11$. The second investor, whom we have commissioned to hold position only during the open market hours loses 70% of the originally invested value -from 1$ to 30 cents. As we can observe this is not a question of underperformance, but one of losing on capital value. As a matter of fact, most of the money is lost simply from trading only during the day.
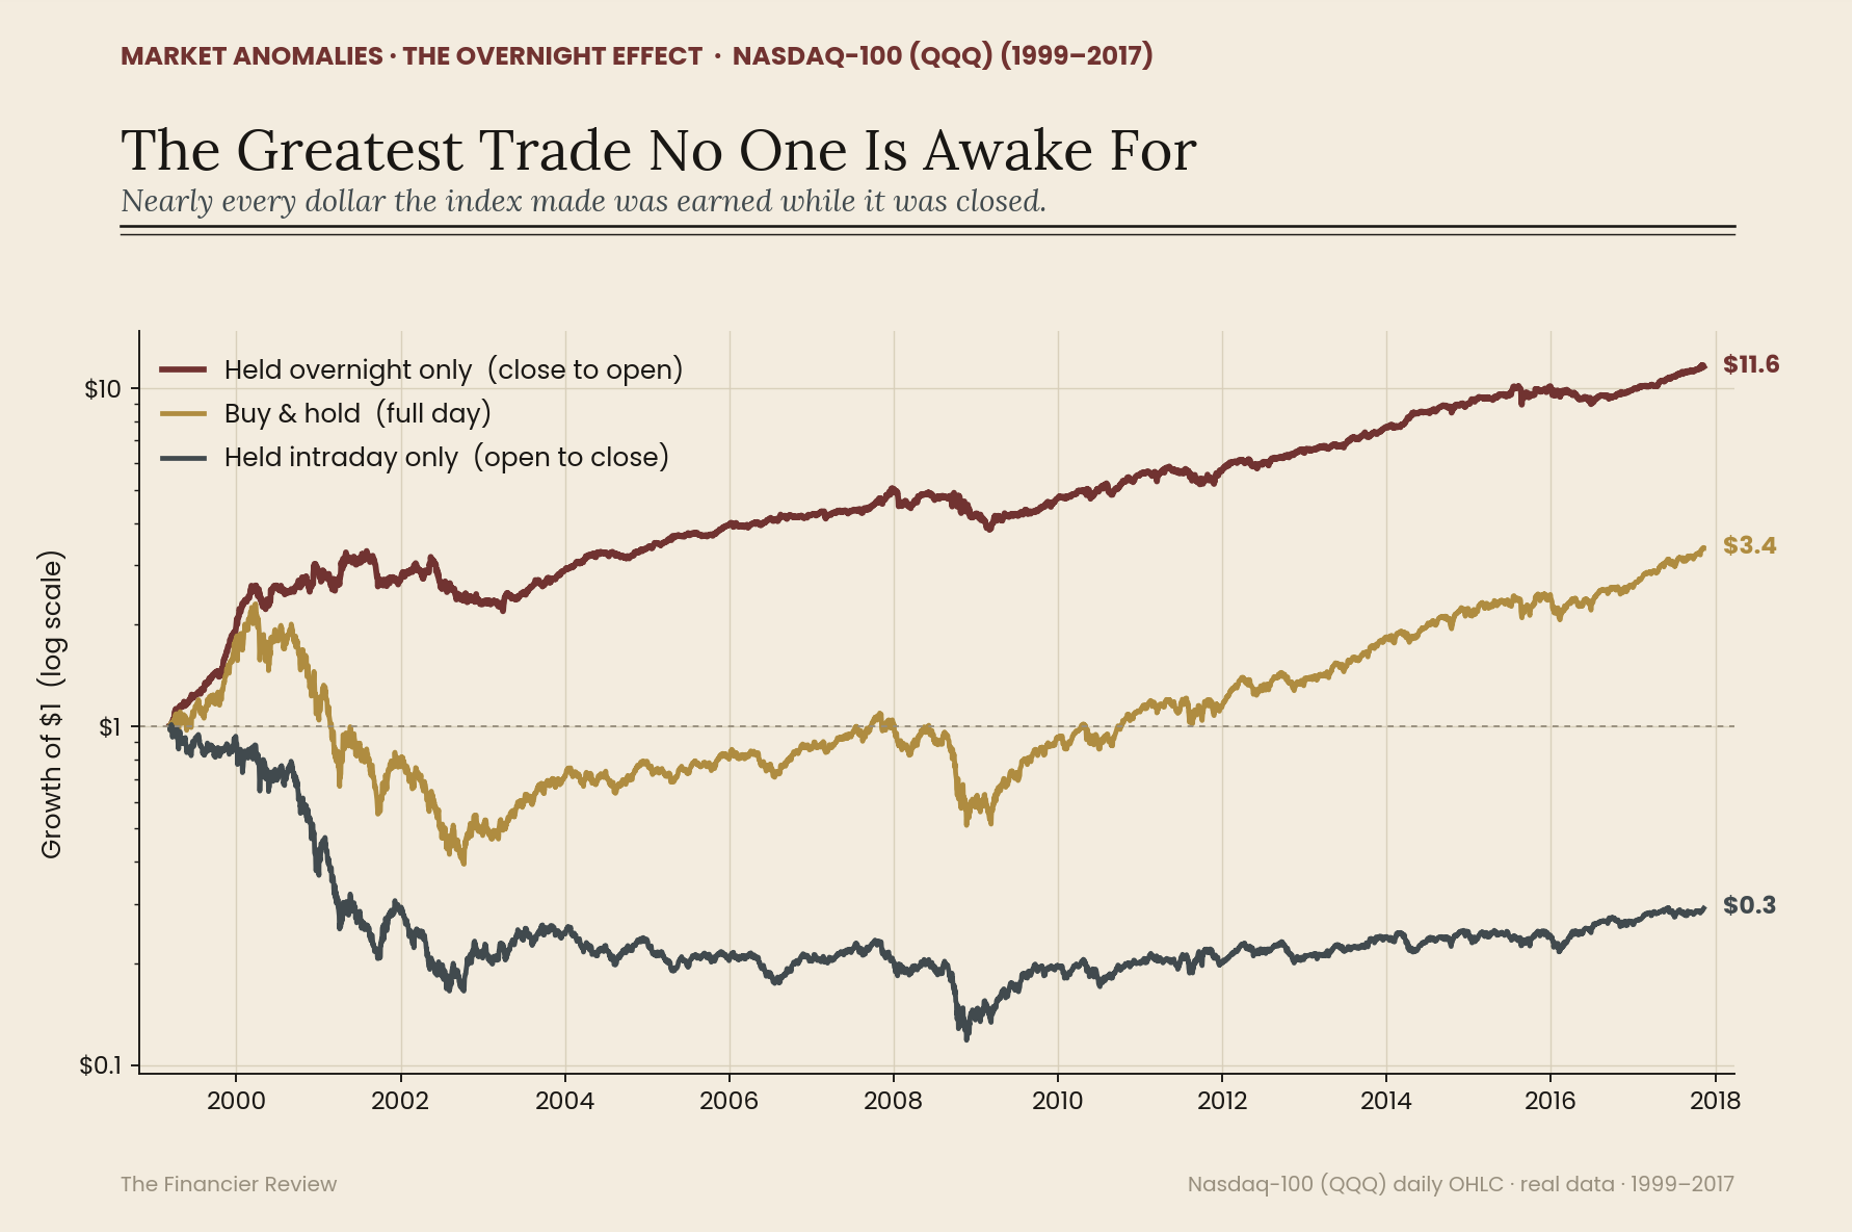
As we noted prior, the index is the same, the set period is exactly 18 years for both investors and the same amount of dividends is also set aside. In other words, one of world’s most famous indices, the cornerstone of innovation and finance experiences growth only overnight. The ascent of the Nasdaq 100 was only delivered during times where nobody can trade or work.
A reference point we have also commissioned – a third investor who also trades with our day-investor and overnight investor but only holds since the first day bought and sells at the end of the period. Data suggests that overnight investing sill outperforms a continuous hold of the index. So, the trading day which markets are open at, where we all treat it as the time to exchange stocks contributed absolutely nothing, arguably even took away.
This phenomenon is not a rounding accident or a tricky move within the study to skew the data. It is a stubborn and very uncomfortable fact related to modern financial markets. A pattern that earned its name because so many people found it and were definitive that it had to wrong.
Thus, we have established that there is a very strange pattern forming during the night – higher gains, compared to losses during the day. In order to understand the underlying cause of this pattern we have to alter our perception of a trading day as a single entity. We are used to stiching a trading day to one number. For instance, if the market went up for a day by +0.5% and then down -2% we tend to join these two separate moves at the opening bell of the market. Every day, a stock makes one move you can watch and one you cannot.
The move which we cannot watch is the one that occurs overnight. When the stock market closes at price “x” in the evening, the subsequent day it opens at a different one. In between the break of the working day, the price drifts. Earnings land after the closing bell and wars begin in different time zones. Therefore, by the time the market opens prices have already moved, quite often substantially without any exchange of share ownership. We would name this the overnight return: from yesterday’s close to the opening of this morning – from dusk to dawn.
The move you can watch is the session itself — the part with the flashing prices. From the opening bell to the close, buyers and sellers push the price around in real time, and it ends the day somewhere. Call this the intraday return: open to close. The hours we actually call "the market."
These two ideas are not an approximation of the daily return on the stock, as a matter of fact they compose it precisely. Here is what we assume as granted: the overnight return we label as Ron and the intraday as Rid. Combined, the full close-to-close (full cycle) return on R is satisfied with the equation.
If we staple these two factors into a single chain across a long horizon of time, the joint forces of the factors reconstruct the familiar buy-and-hold return precisely. In essence, the total return of the index is simply being compartmentalized by a “seam” that runs through every day. This “seam” in practice separates the hours of when the stock exchange was open and when it was shut.
We are not questioning if this is an abstract concept whether the night of the market day matters, but we are splitting the returns on a stock to two cumulative series, subsequently comparing them. From all this we can derive a single question: With the time of decades on our hands, which of the two sessions really carried the most benefit for the index. As we saw in the first section, in practice the overnight does marginally outpace the intraday return, but the more important assessment to be made here is does this gap survive being attacked? By attacked we mean if it survives across decades of data, different indices, and moment where the market was most volatile.
From a statistical standpoint, a single divergence of an index over a single stretch of history does not provide sufficient support to make a hard claim that overnight beats intraday in returns. Two cumulative series like the ones we have here Ron , Rid can drift apart for years based just on sheer luck. Financial data is littered with one-off patters that seem extremely dazzling yet they never appear again. Therefore, our duty is to scrutinize the gap between the day and the night until it refuses to disappear. So here are our attack strategies:
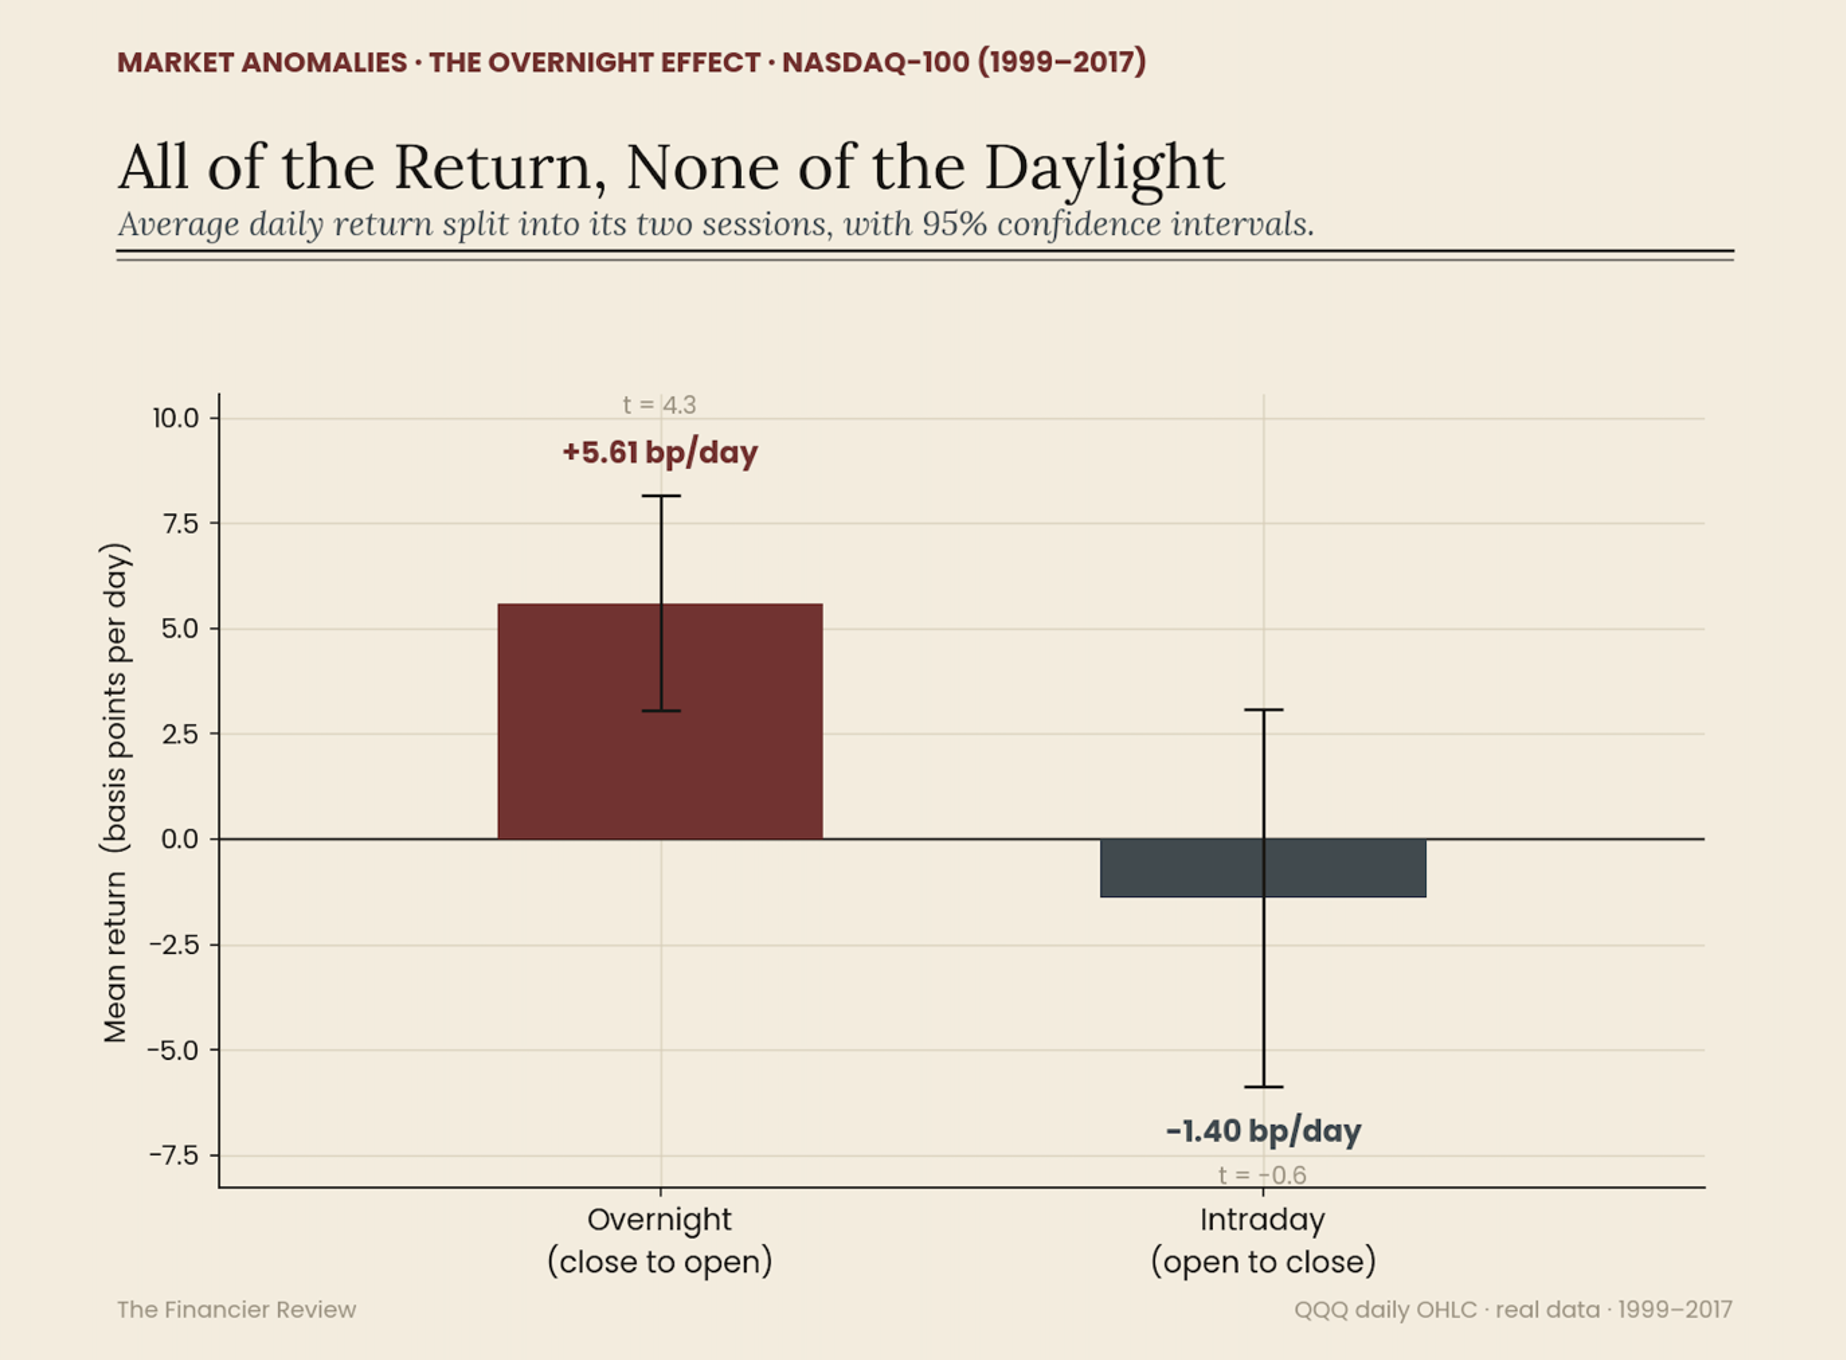
Not simply noise – a very primitive objection that the edge of the overnight period is simply a statistical error and that a small average is dressed up as favorable returns. To our attention, the numbers show exactly the opposite when tested. If we were to decompose the entire sample, the NASDAQ’s overnight returns yield us a positive number with a t-statistic at ≈ 4.3. In contrast, day returns are statistically approaching zero, and in fact veering towards a negative number.
A “t-rating” of 4.3 is hardly a close call for the noise theory to be correct. It is the kind of separation that, under the null hypothesis of "no difference," should appear by chance only a handful of times in ten thousand. Whatever the case for this phenomenon is certainly not residue of a favourable time period.
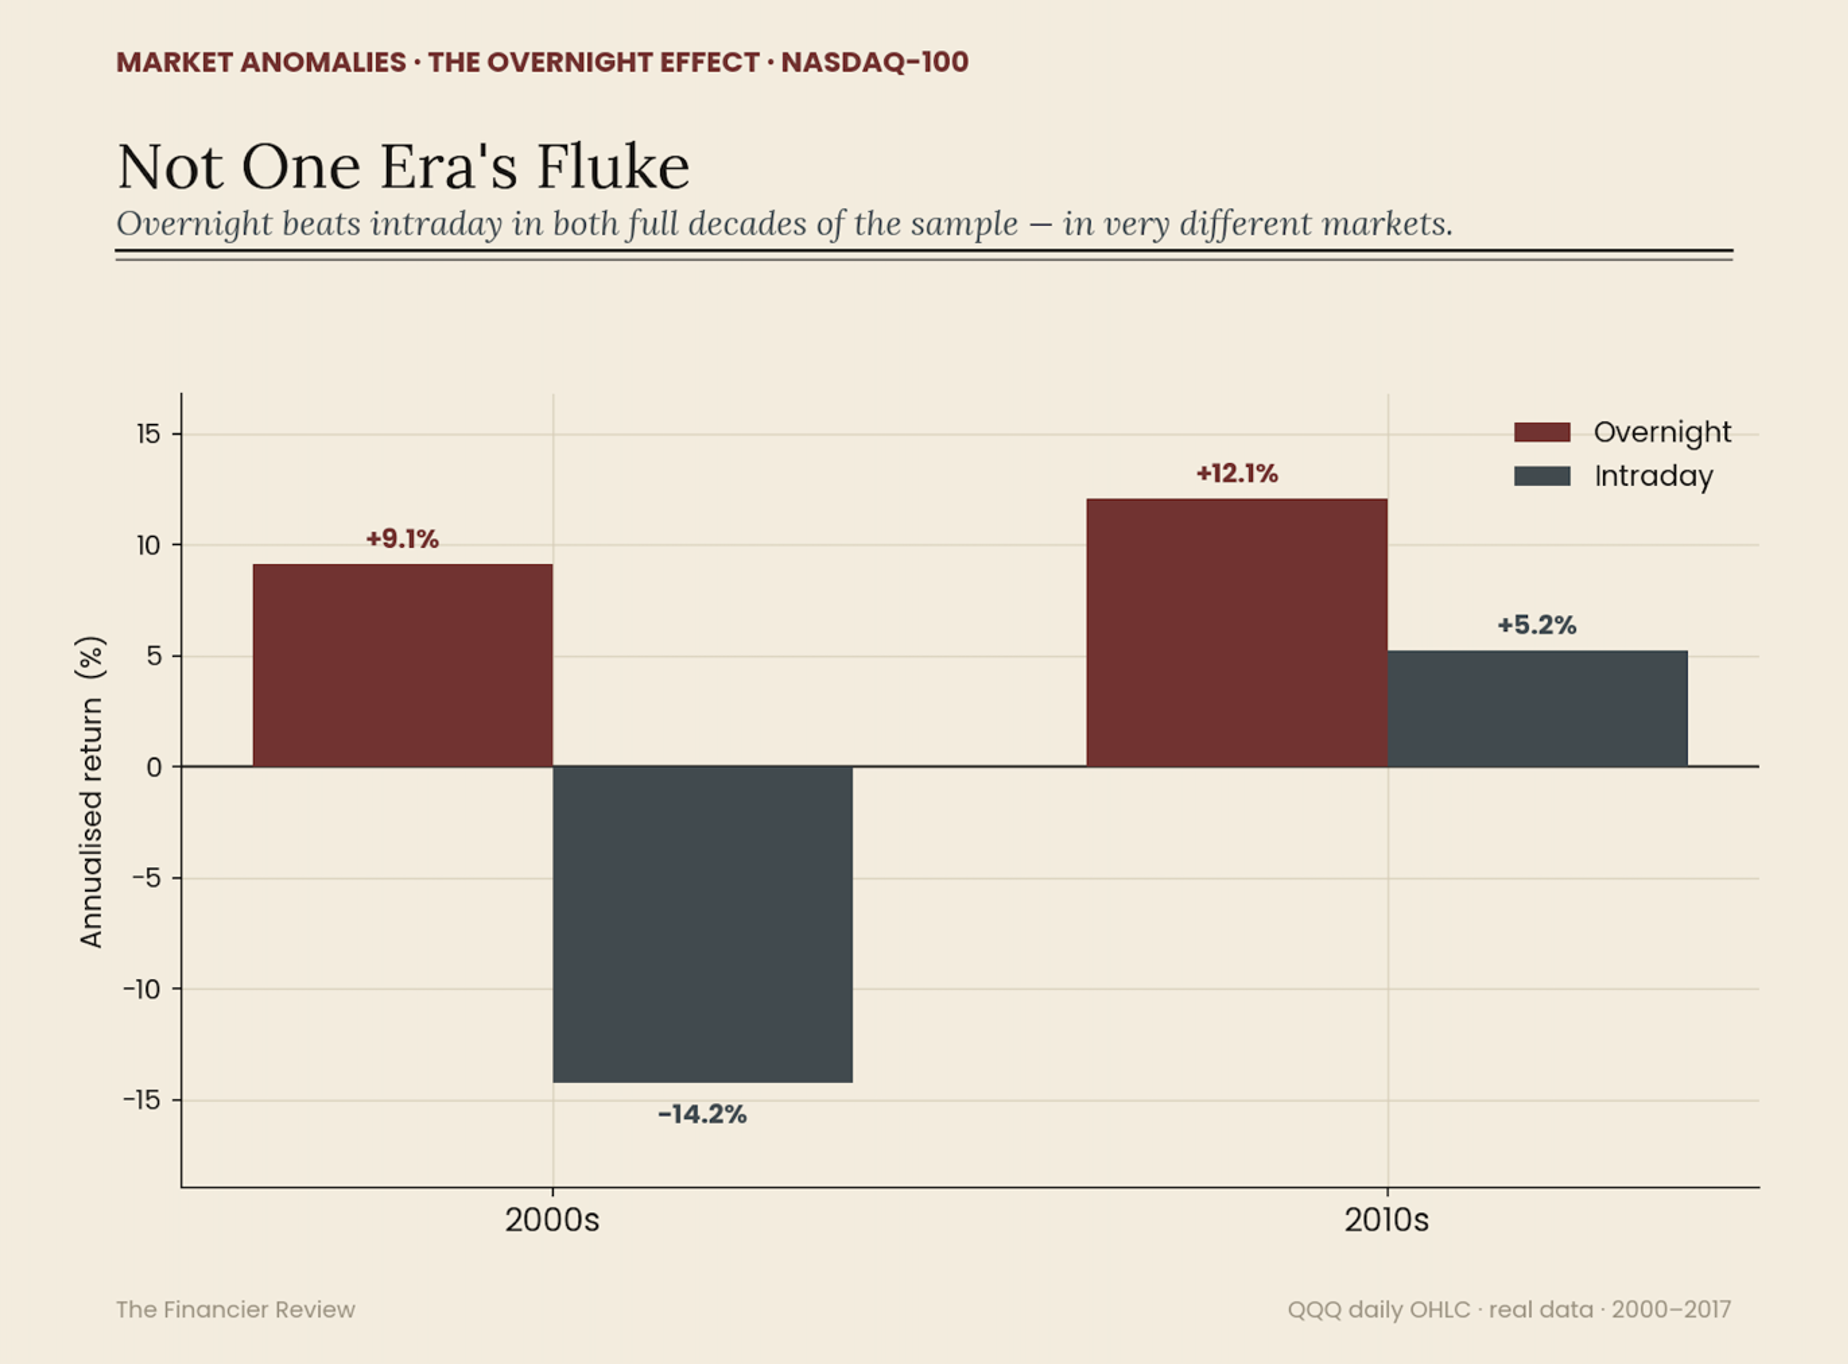
The next plausible critique that we can make here is that this strong growth is related to an era of the stock market. Theoretically this growth could be also an implication of a single regime. An example of such could be anything from the dot-com boom, 2009 bull market following the 2008 Financial Crisis. For purposes here we cut the sample into decades and then the disguise of a potential frenzy vanishes. The overnight returns aren’t superior because of an extraordinary business or economics event. It consistently outperforms the 2000s and the 2010s in a similar manner. Regardless of economic and financial contractions or expansions the trend seems to be present. Of course, the magnitude of the scale fluctuates, but the sign never flips.
From here, we observed the idea of just noise, and the era theory which both came out false, so what else can we scrutinise – market scale. Does this pattern only appear for a single index? An objection we could have here is that the whole phenomenon is idiosyncratic, tied to solely this index. Afterall, the NASDAQ is a tech heavy basket, which could mean for our time period it was something extraordinary in the sector. This scrutiny would have ground, but if we widen our lenses to the entire American equities market the patten holds with near perfection. In almost every case, with very few exceptions the overnight session carries the majority of the returns, and the intraday session contributes with little to nothing. And exactly here is the key to our investigation. The trend breakdowns outside the U.S, a very important clue to which we would return and discuss later.
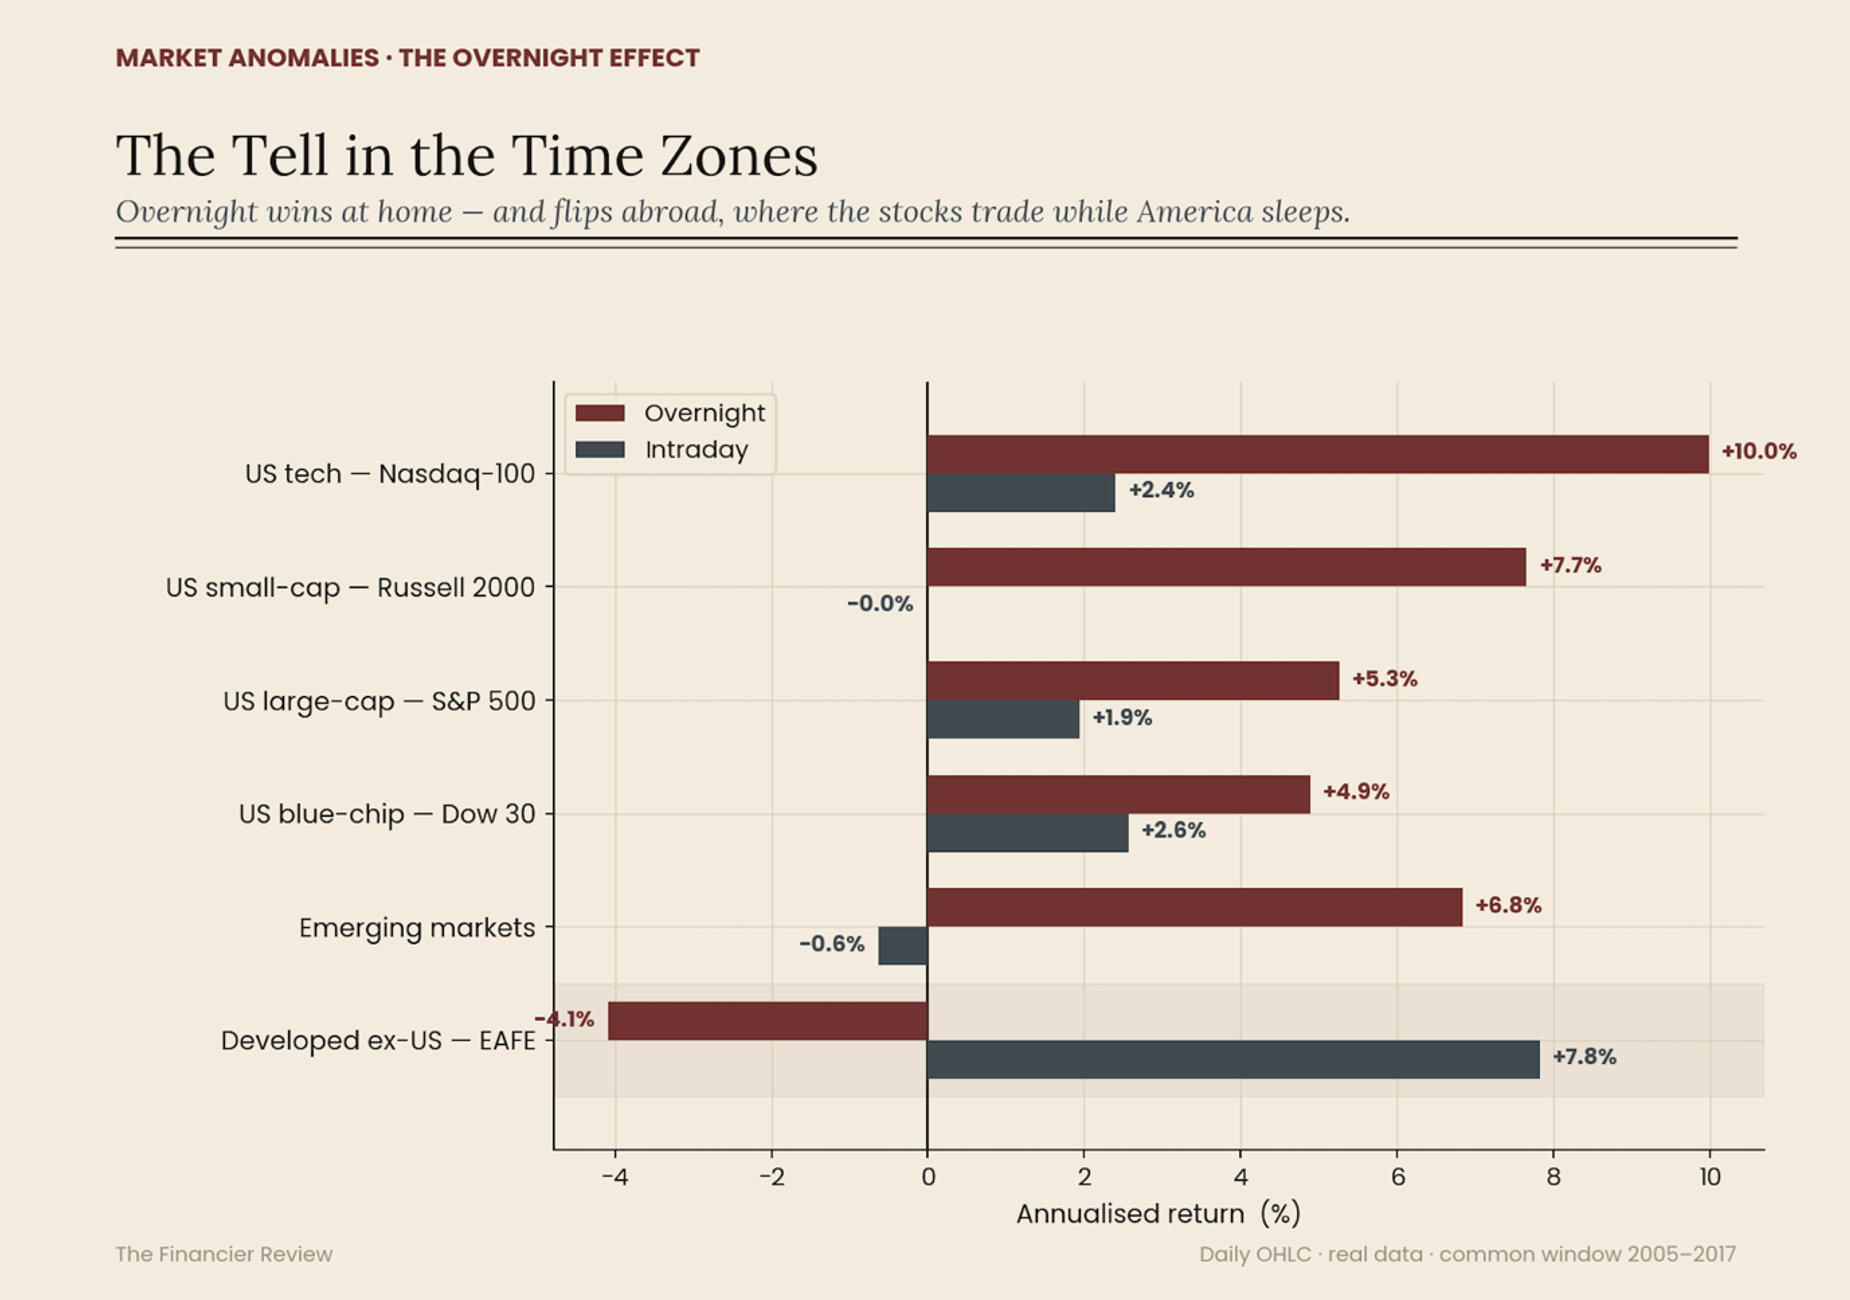
With the three attack moves the overnight rally continues to have a statistical advantage that is sharp, persistent and broadly present in the market. With this it leaves us to the uncomfortable possibility that we must deal with the trend is real.
By now the overnight returns have created a sort of character that we tend to associate with. They are steady, quite frankly dull and compounding at times nobody is available to see. Perhaps, the natural conclusion would be that such a no-drawback reward comes wrapped in some form of underlying danger. The price of those outperforming returns is lurking, hidden in the dark hours of the day. A very intuitive trade-off that conventional financial theory has embedded in us that the higher the returns, the larger the risk. Surely then, if the night is so giving for an investor, then it must take away in some form, right? Quite the opposite actually. The danger in the market is only materialized during the day.
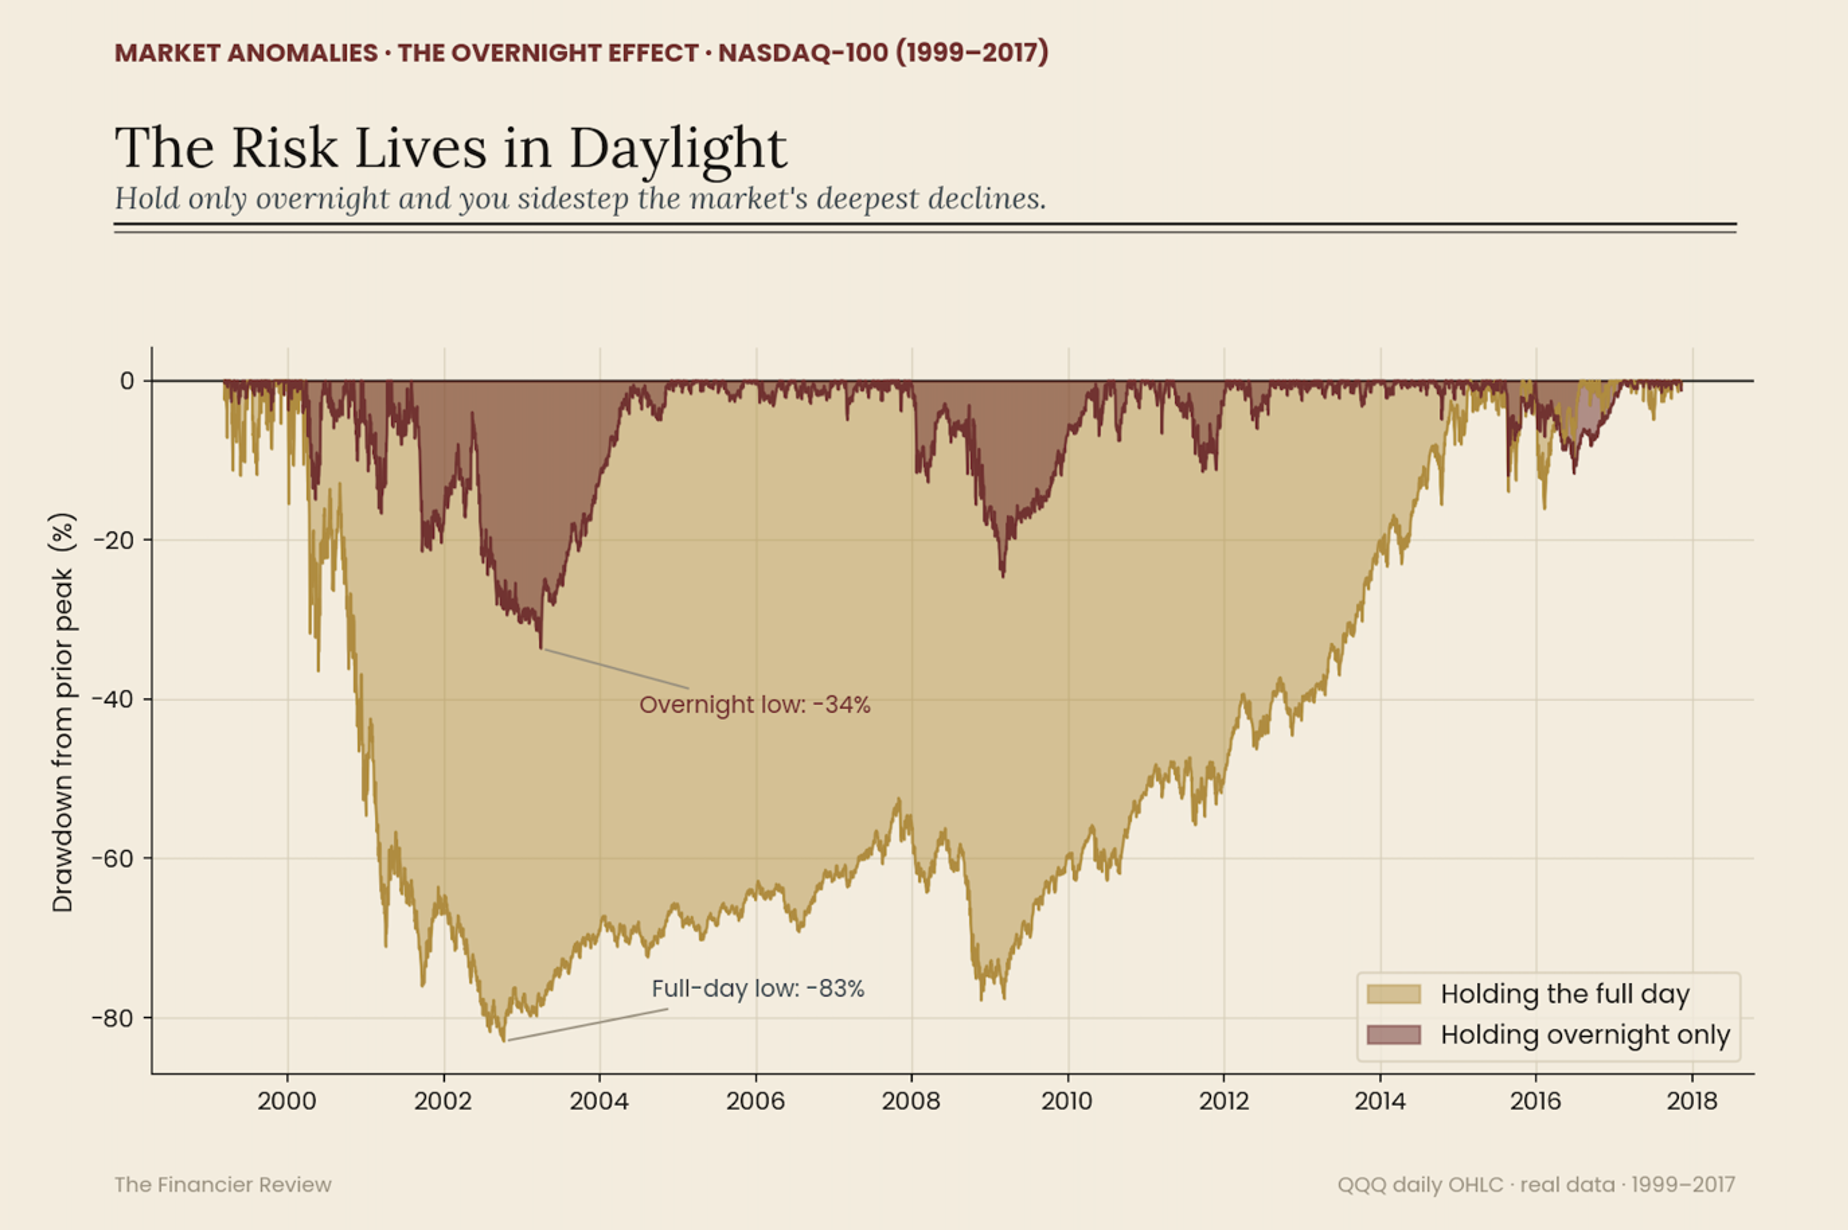
If we were to trace the bleeds in the market for each strategy we can conclude definitively. Holders overnight tend to lose less and are a lot quicker to recover. Major dips (-50%) typical for the full day holding profile take years to recover from. Further, the most significant dips and the larger portion of them are part of the intraday holding. Catastrophic events such as 2008 and 2020 Covid Pandemic take effect during the day.
This insignificant detail turns this into an interesting phenomenon to a structural matter. If the overnight session merely earned more and risked more, there would be no puzzle – just leverage by another name, a fair wage for fear. But that is not what the data shows. Intriguingly, the night has higher returns while also exposing to less risk. It collects the returns and almost entirely skips the volatility in the market. Looking at the daytime profile, we can cleanly state that it absorbs most of the frictional impact from market events, while scarcely rewarding – if at all.
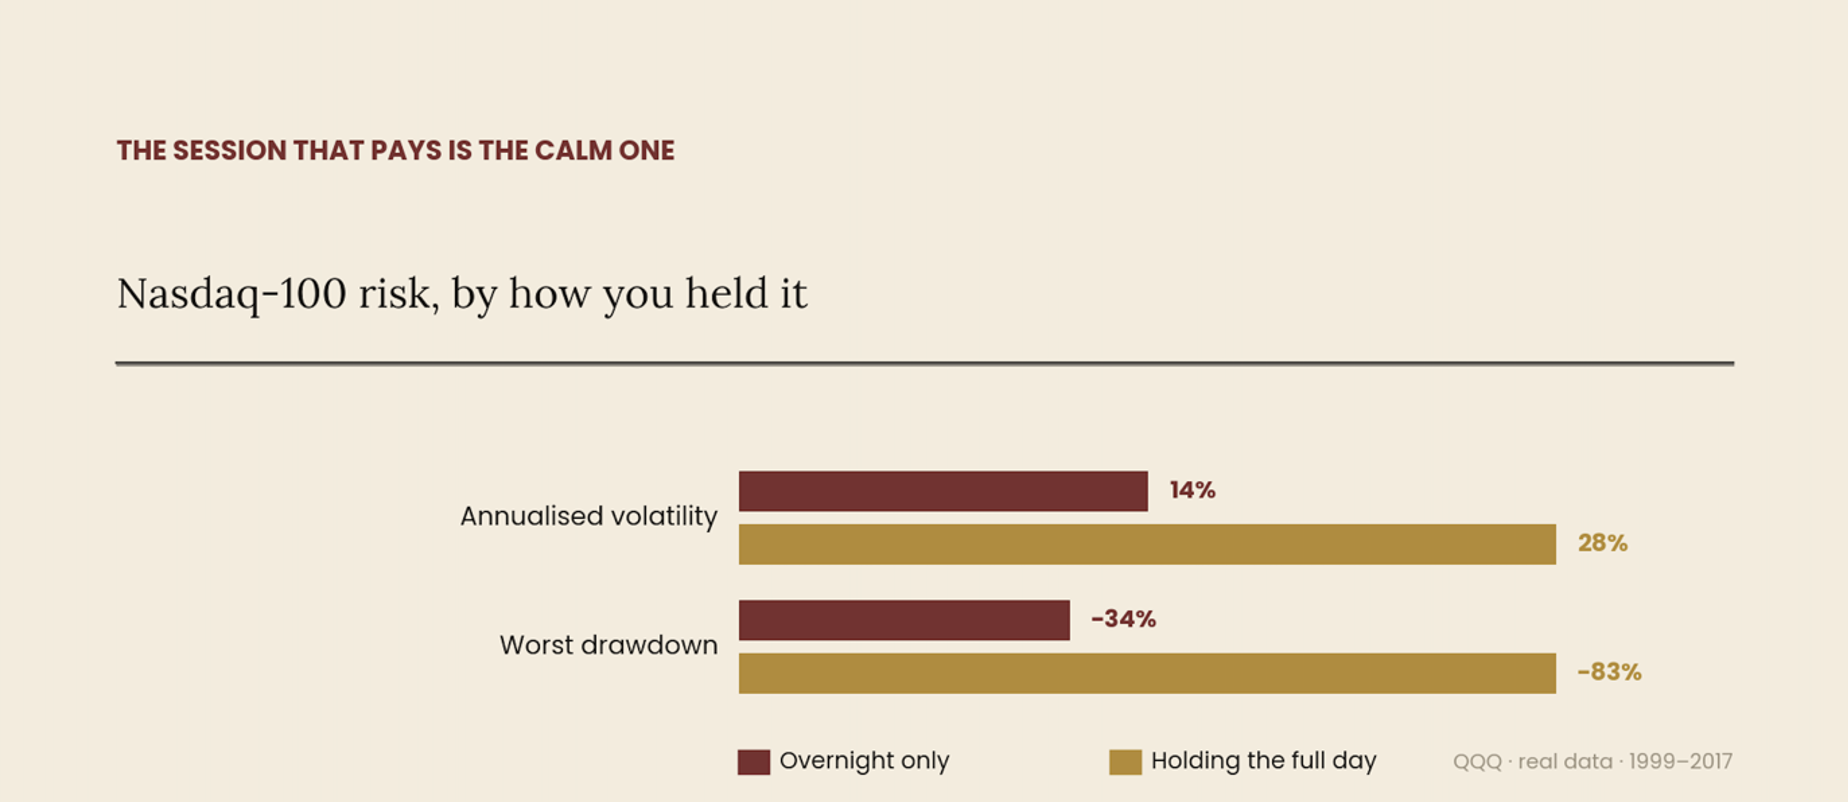
Whatever is happening to the market at dark times cannot be explained through traditional risk and rewards which we could see in models like CAPM and similar ones. Here: a higher return does not mean a higher risk. In a market that is supposed to price risk in its foundation, the session that pays the most shouldn’t be the afterhours one.
While this pattern must be accounted for, the exact reason for its presence isn’t really known. We can consider a plethora of reasons concerning this problem, but evidence does not exclusively favor one over the other. Further, these events are not mutually exclusive therefore their forces act together to bring the overnight effect. The best practice forward is to narrow the factors down to the main suspects causing our trend.
The first candidate that we might consider is a risk premium, causing this effect. Afterall the primary function of financial markets is to price risk. Since the stock exchanges are closed at a late hour, holders are not able to adjust their positions. In that time interval, important world news might arrive which exposes them to a risk that cannot be hedged against. Remember, the market is still not open therefore these equity owners are frozen overnight. With this in mind, a plausible explanation could be that the outperforming overnight returns are just a byproduct of the required bearing risk exposure.
While this explanation seems very reasonable and simple, it is hard to sustain this data. As our previous section mentioned, the overnight trading session sustained lowered volatility and shallower drawdown in comparison with the day trading profile. A premium where the maximum effect is exhibited at smaller measured risk inverts the usual direct relationship. Here instead of having a directly proportional relationship we observe an inverse relationship.
But as per usual there is an exception to the simplicity of this explanation. A very specific version of this theory does have empirical support. Recent work on asset pricing found that the compensation for systematic risk — the cross-sectional reward for market beta, the central prediction of the Capital Asset Pricing Model — accrues almost entirely overnight. Beta, or the sensitivity of the individual stock in relation to the market is estimated to be flat and at time negative to the return. With the overnight session positive-beta return of CAPM reappears. The SML (Security Market Line), which we investigated in our CAPM guide appears to be a nocturnal phenomenon. It holds mostly when the market is vulnerable and closed, while it disappears during the day.
Thus, this point does not resolve the mystery of the overnight trade outperforming the day one, but it sharpens our investigative idea. Arguably, the suggestion made here is that risk is priced in the market itself, but only on one of the clocks. It offers no explanation as to why it chooses the overnight one. The risk-based account is therefore not refuted but relocated: the compensation standard theory predicts is present, yet concentrated in a window the theory gives no reason to privilege.
Another objective candidate responsible for the origin of our unexplained phenomenon lies in the mechanics of trading, rather than risk itself. The day session does not begin continuously through the last close call, but through an opening auction where the accumulated orders clear at a single price. Evidence suggests that a large portion regarding the flow of orders materialized around the open. Most importantly this type of order flow is non-discretionary. In simple terms “non-discretionary” means that a trade happens only because a rule or a schedule practice compels it to, not because an investor formed a view that the asset is mispriced. We can view it as a transaction that we must do, instead of based on opinion or value. Therefore, events like Index funds investing inflows, ETFs rebalancing, futures rolling, and other mandate-driven demand that transacts on schedule rather than on view occur.
So, if this structural demand pressures the prices upwards at open, a component of the measured return is bound to reflect order-flow imbalance more than information. Following the logic of this interpretation, part of the premium that the overnight session returns is a microstructural artefact. It simply reflects price-insensitive larger-scale participants required to trade. The principal difficulty is magnitude: it is not established that mechanical flows are large or persistent enough to account for the full effect over decades. We can’t tell with certainty that there are enough large-scale players to persistently account for the morning surge and the accumulation in such extensive time periods.
Onto our third pattern candidate. We saw the appearance and disappearance of the SML as a nocturnal phenomenon, we observed the power of large institutions conducting scheduled balancing investments, so what’s left? The logic we would follow here is: what is the most valuable commodity on any financial market? What is the bread and butter of decision making? Information. A notable distribution of value-relevant news is released while the stock market is closed. Events such as corporate earnings reports, central-bank developments and other occurrences as such, we hypothesize, tend to also aid overnight growth. Following this principle if the majority of information arrives as night when everybody is asleep or unable to act on the stock market, then much of the repricing on the stock market happens overnight. Therefore, the trading day contributes comparatively more towards noise rather than signal.
Unfortunately for us, this explanation is also plausible, but most definitely incomplete. The timing of information can account for elevated overnight variance, but to explain a persistent positive drift it must additionally assume that overnight news is, on average, favorable across the sample. Such a condition holds mechanically in a long-rising market but by itself cannot be an explanation. To even verify that this claim has any empirical ground and isn’t solely a theoretical framework we conducted a small experiment.
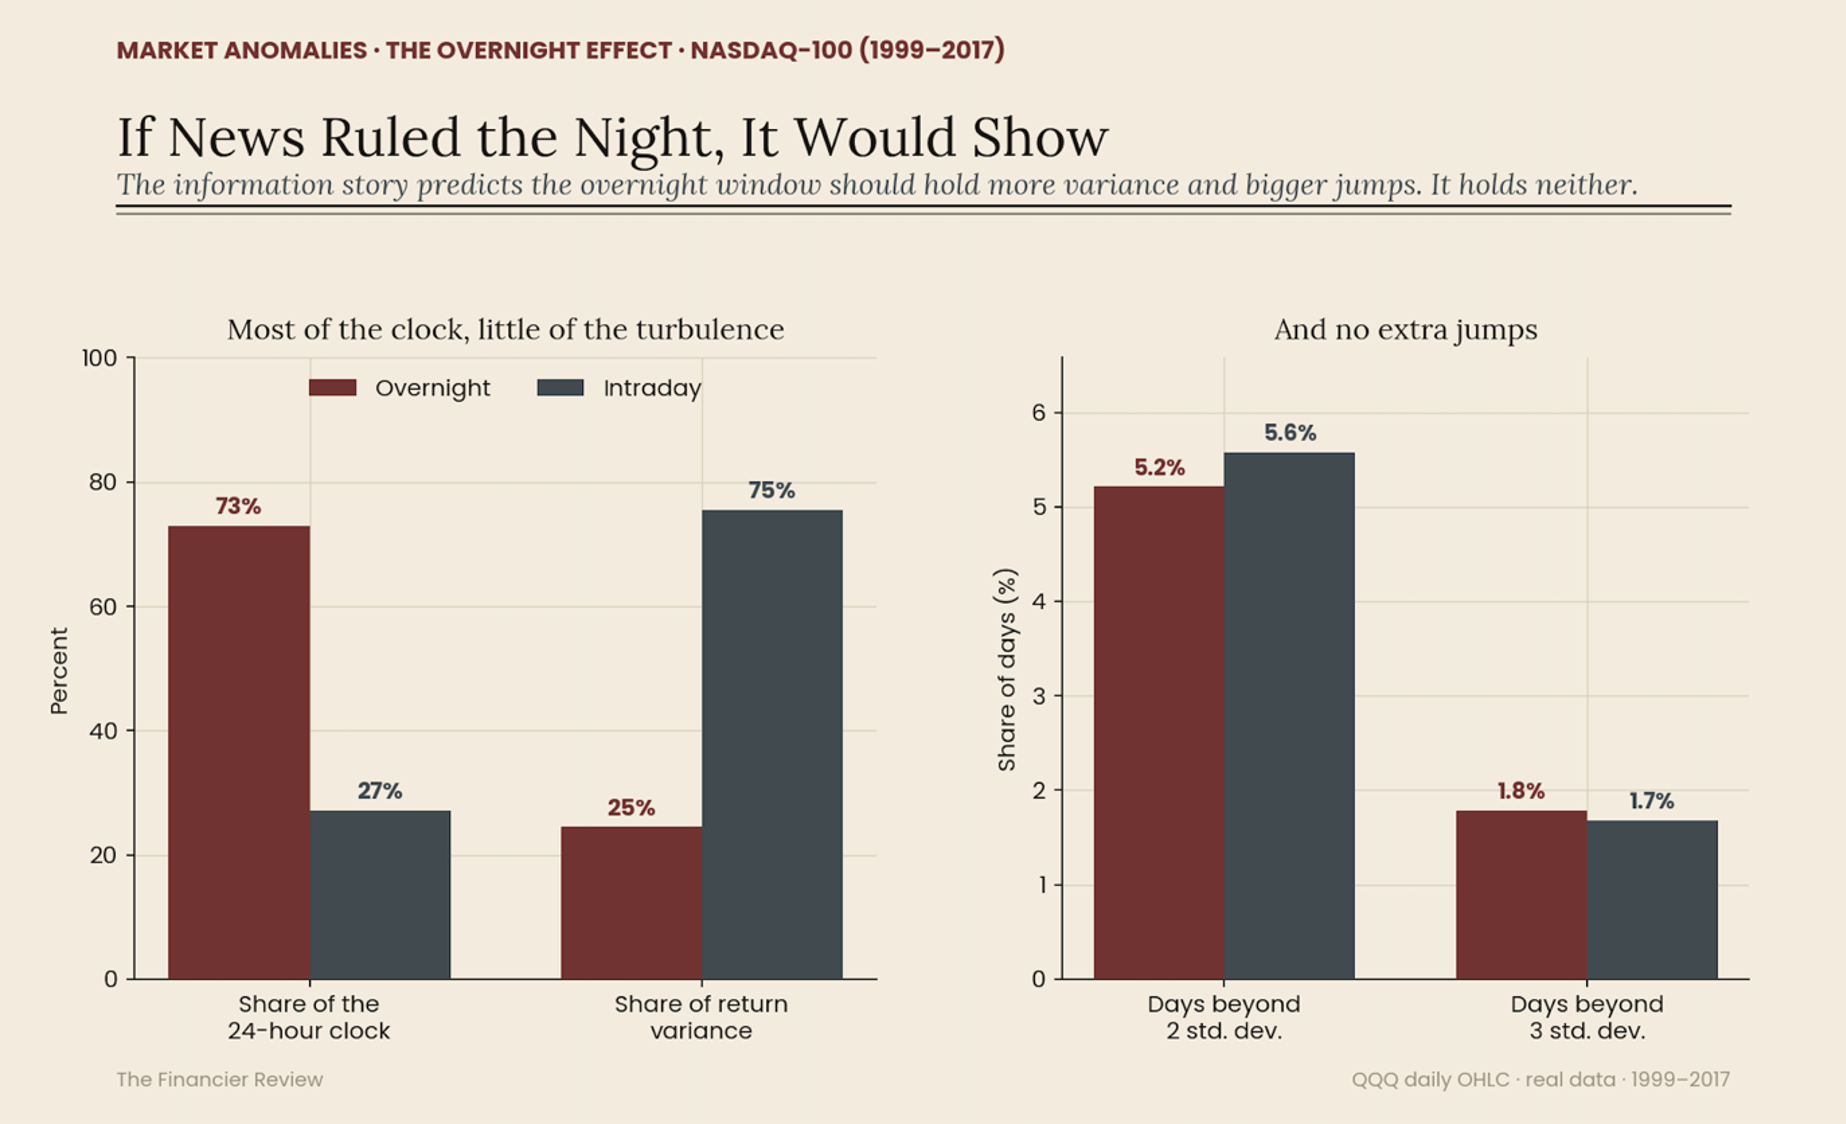
If the overnight return were the market absorbing a night's worth of news, the overnight window should be where the turbulence lives — yet it is not. Although the closed market spans roughly 73% of the twenty-four-hour clock, it accounts for just a quarter of the index's daily return variance; the trading day, a mere 27% of the clock, generates the remaining three-quarters. Nor is the overnight session unusually prone to violent moves: large jumps — days beyond two or three standard deviations — occur at virtually the same rate in both sessions. This is the long-established pattern that volatility is produced by trading itself, not by the passage of time or the arrival of headlines. News may contribute at the margin, but it cannot be the engine: the hours that earn the return are conspicuously not the hours that carry the risk.
And here we are again at square zero with this theory, in practice the account of information to explain this pattern is negligible.
Can we say that by human nature the type of investor can have such a magnitude of influence over the outperforming growth of the overnight session? Well to a certain extent. Positions characterized by night investors are held disproportionately by longer-horizon, less-leverage constrained investors. Conversely, daytime traders are far more leveraged, short horizon and also classified as discretionary traders. If these clienteles differ systematically in their trading, the intraday session may transfer return – via spreads, price impact, and reaction – from one group to the other. We can label this as a sort of “tug of war”, in which the different return factors remain for each session. This theory has also received large empirical attention, by attributing an aggregate index effect to the composition of participants. Yet, this all remains difficult to establish cleanly.
Another very intriguing observation to this phenomenon is the overnight effect on non-US equities. It seems like the effect is inverted for funds holding European and Asian stocks. The intraday session tends to significantly outperform the night profile. So how does this even have ground? Is it possible that U.S. equities are nocturnal and the rest of the world gains mostly during the day? The most economical explanation to this event is that those securities trade during their own local hours, which all fall in between the overnight New York overnight window. Intuitively, an implication here is that a portion of the overnight return is not a property of non-trading hours, but for some markets it is the trading hours that accumulate the growth – just observed from the perspective of the Wall Street.
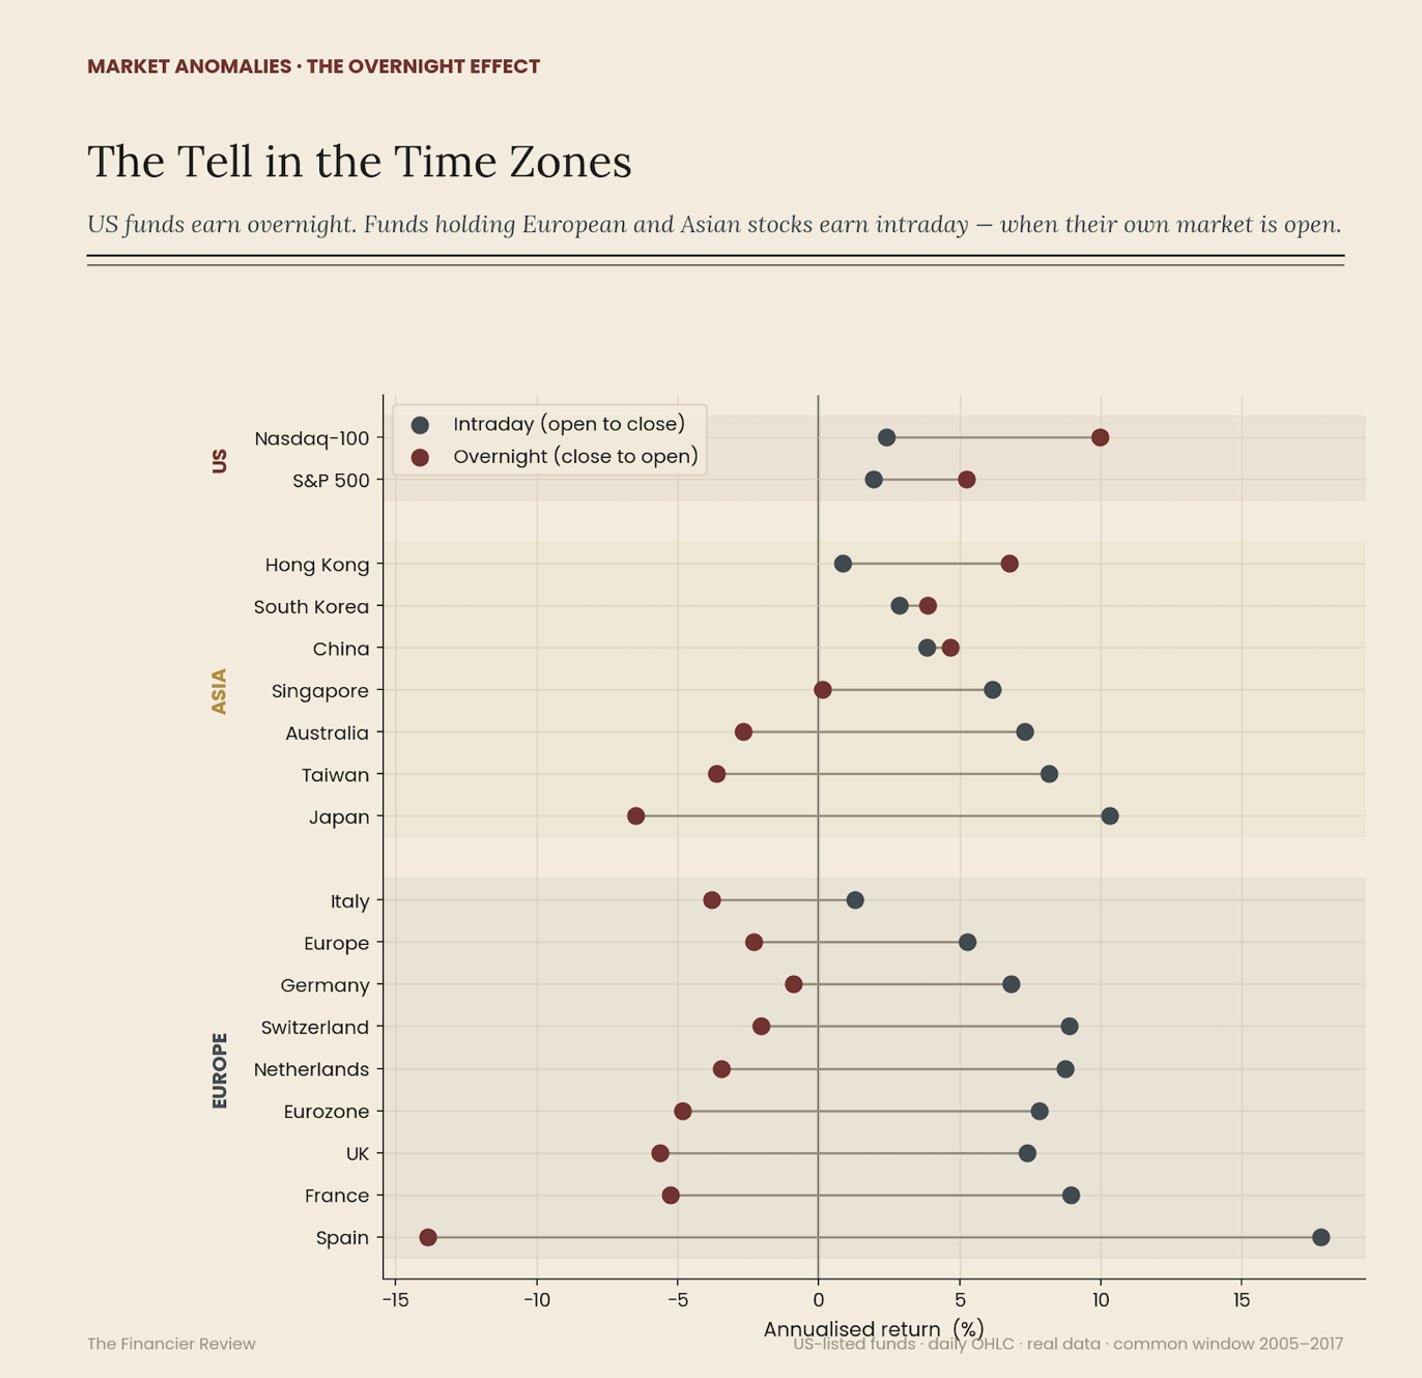
From the observations of the graph above, this relationship is almost perfectly inverted for markets outside of the U.S. with some exceptions. These exceptions include China, South Korea and most notably Hong Kong. With the latter pair the difference between overnight and intraday on returns is negligible at less than a percent for annualized returns.
No single mechanism accounts for the full effect, and the most defensible reading is that the overnight premium is overdetermined: a concentration of systematic risk compensation in the overnight window for reasons not yet understood. Some factors include microstructural contribution from scheduled order flow, an informational contribution from the timing of news, and a distributional contribution from differences in participation.
The relative weight of each remains an open empirical question. What can be stated with confidence is narrower and is the finding itself rather than its explanation: across a long sample, the return has accrued on one of the market's two clocks, and standard theory does not say why.
If you followed this far and understood the contents, we are certain that a natural question has risen: if the overnight return is so unshakable with persistency, scale and growth, why not simply ride the wave of nocturnal trading and harvest it. You simply hold the index overnight, sit in cash during the day and collect the large premium which the market seemingly leaves unattended. While this strategy looks and feels like an absolute winner on paper, it is mostly untradable in practice. The reasons behind the untradeability are more mechanical rather than mysterious like the cause of overnight growth.
Primarily, we have to consider the fact that the calculated premium of the overnight session is gross figure, not a net one. These are all returns before the cost of transacting. A simple calculation yields that for a nocturnal session to work we mandate a transaction twice per cycle – a buy at the close and a sell at opening. Those are roughly 250 trades per year. Measured edge per trade is small, on the order of a few basis points per day. Against that thin margin stands the bid-ask spread, and the spread is widest precisely where the premium is supposed to live — at the open, when the market is still digesting the night.
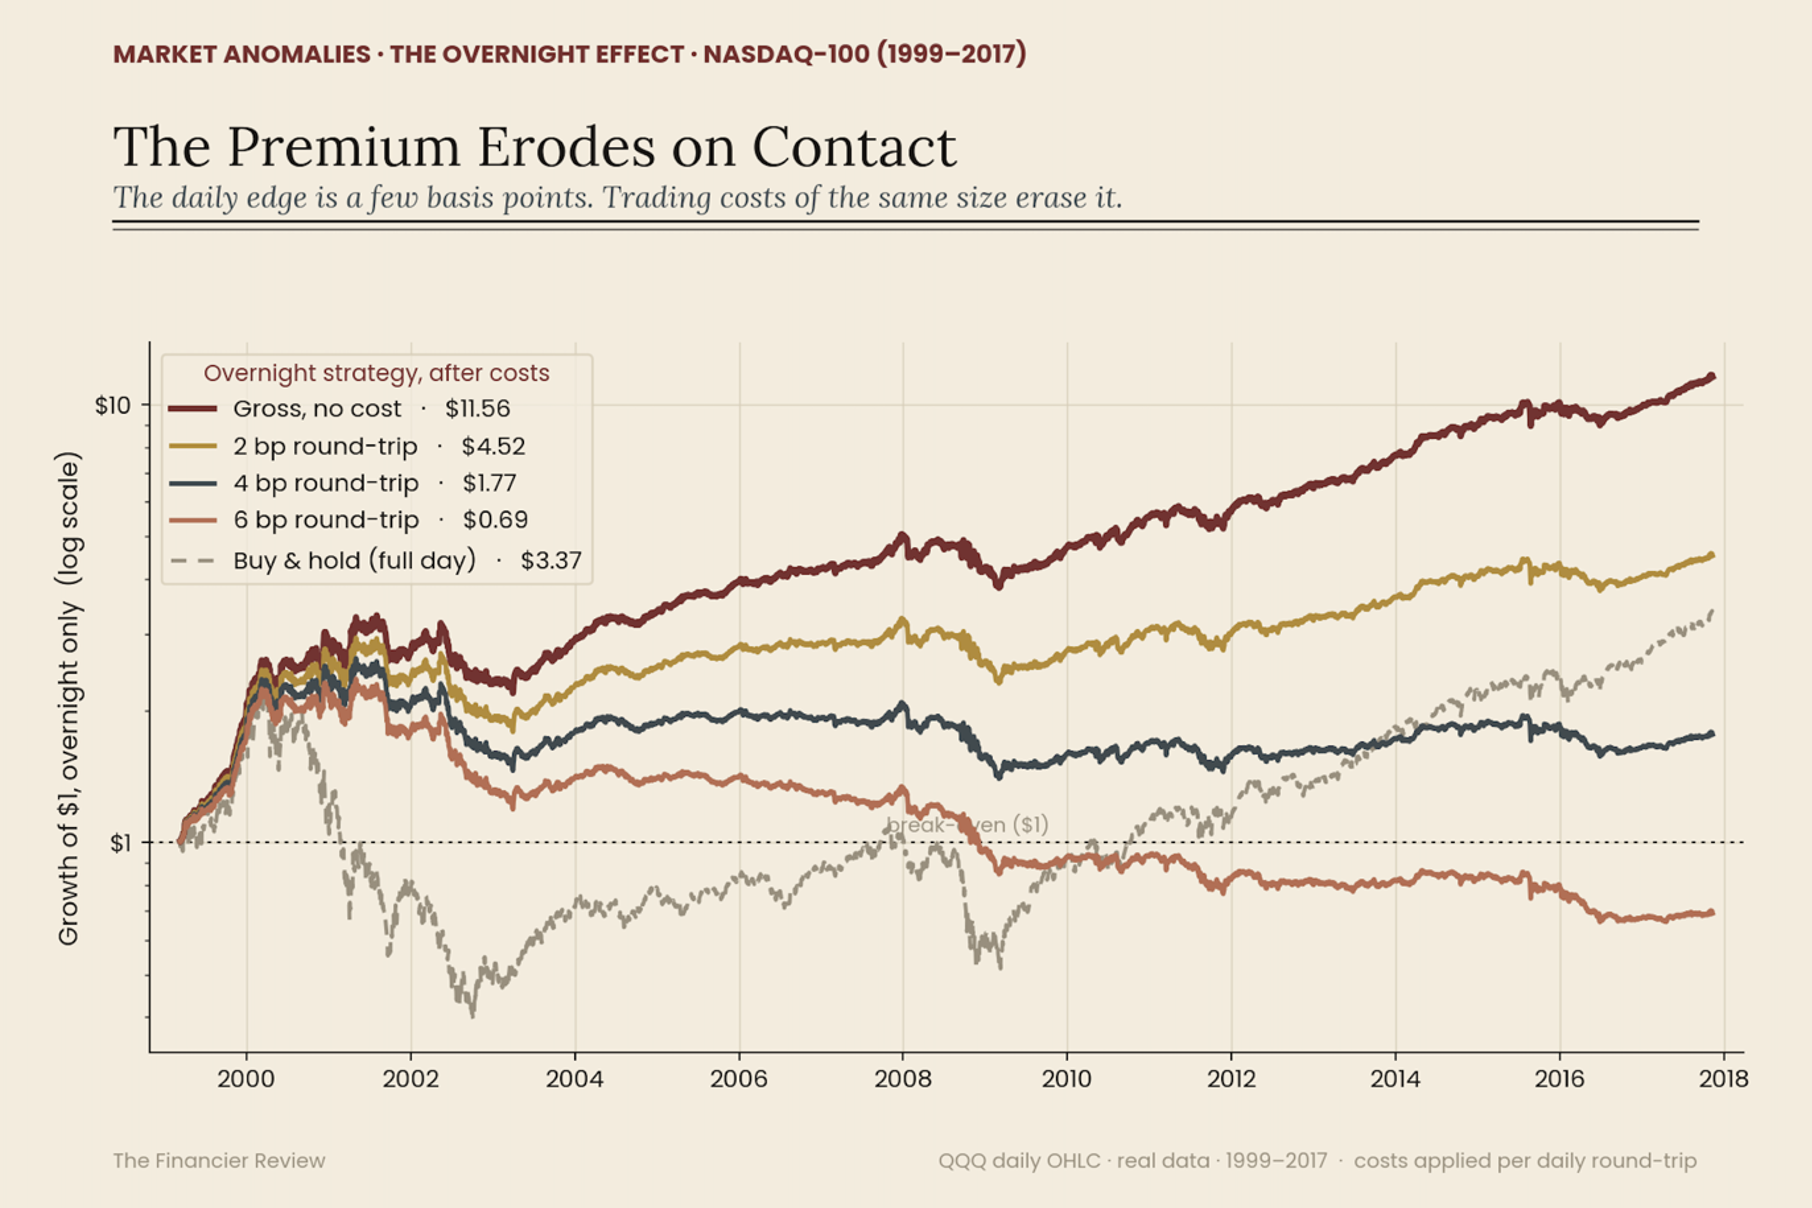
Another very realistic issue related to this practice is the large demand for liquidity at open. The price which we used for “opening” is the official print, the single value produced by the opening auction. A very clean and friendly number for analysis, but it is certainly not a quote that an investor can attain, even more so with size. A demand for liquidity at the opening of the stock market moves the price against the investor and introduces slippage that the historical series, recording only the realized print, never sees.
There is also a possibility that the recorded premium might not survive the harvest. Some part of the overnight returns, as microstructure suggests that plausibly a footprint of non-discretionary flow transacts at open. Return generated by the combined forces of institutional investors is not a return that tolerates a crowd. A trader attempting to front-run the flow essentially becomes part of it. Strategies involving scaling becomes the very pressure it is trying to exploit. Subsequently, the effect of this kind tends to decay as they are more known, followed by the capital to capture them. There is some evidence the overnight premium has softened in exactly the period it became widely documented.
And the position is awkward to hold. An overnight-only strategy is in cash for the entire trading day, putting its capital to work only a fraction of the time. To match the dollar returns of simply owning the index, an investor would have to apply leverage — borrowing to amplify a small daily edge — which reintroduces financing costs, margin risk, and the possibility of forced liquidation at the worst moment.
At last, we can summarize with the fact that the aforementioned findings do not diminish the theory but sharpens what the theory suggests. The overnight effect is a true statement about how the market's return has been distributed across the hours of the day. It is not, and was never, a button one could press to extract that return. The premium is real; it simply does not survive contact with the act of trying to take it.
Now for what is worth the objective course of action here is to begin with what survived our tests.
Quite plainly, the overnight effect is largely untradeable, may never be fully explained and only rests in data. On a single, dollar-denominated 18-year period, ending in 2017. It would be incredibly easy to just dismiss this entire phenomenon due to its impracticality, but the matter of the fact is that it would be mistake. While we might just consider it as a curious pattern, a quirk, or a microstructural footnote the findings don’t have to be tradeable to be true. Further, it does not need to be explained to be important. The disturbance is not from a strategy, but from an assumption.
Most of us carry the notion of the stock market being the trading day itself – the floor, the open outcry, the scroll of prices, the bell that opens and the bell that closes. The return materialized here in the point of day; in the hours we can watch. The night being simply a gap between the performances, a sort of intermission in which inconsequence is the trend.
Meanwhile, data suggests the polar opposite of this preconceived notion. And it does do without any ambiguity. The contest we watch all day is, in aggregate, very nearly a wash — a great deal of motion, considerable risk, and almost no accumulated reward. Objectively, advance happens at a completely different time, in the closed hours where everybody is asleep and preparing for the next day, a time where in the silent reconciliation between one day’s close and the next day’s open.
Strangely, the weirdness of this whole pattern accumulates the closer you look. The session which returns to us the most is not the day session which has all the violence of the market and its forces, but the one where nobody looks. The reward and the risk have been separated by a time segment, which is not how risk is supposed to behave. The compensation for bearing market risk itself — the upward-sloping line this publication once called the most elegant idea in finance — appears, on the evidence, to be a largely nocturnal arrangement, present in the dark and faint in the light. Further, the night is not even uniformly “dark” in a traditional sense. Decompose from a pivoting point of the U.S. to other countries and it presents itself in some instances at daylight, various auctions and different markets.
None of what we understand about finance and coined as “textbook” happens here. The textbook has elaborate understandings of the market when awake, watched and efficient in business hours. We consider off-hours as dead time, but when we look at the data, we see the trend. Given the evidence, it inverts entirely our understanding and fundamental model for pricing risk. Whatever the market is doing to generate its returns, it is doing it mostly while closed, mostly without trading, mostly out of sight.
That precisely is the unsettling residue left from the overnight effect, and it still manages to outlast every caveat and scrutiny. But as standard scientific approach suggests, a theory stands true until proven false. We have spent nearly a century building the most elaborate models and in understanding of a market that we believed we are watching. Well, turns out that we were watching the completely incorrect “shift” of the stock market.
There is an idea in finance under many names such as the McLean-Pontiff finding on publication decay which narrows down to a simple crowding effect. In essence, the more you examine something and act on behalf of said investigation the less it behaves like it is supposed to. Therefore, this leaves a question which is possibly impossible to answer: is the market so overanalyzed that large gains happen at time which should not? To that question we may never have an answer, but one idea is for certain.
Bibliography & References
Primary literature — the overnight effect
Cliff, M. T., Cooper, M. J., & Gulen, H. (2008). Return Differences Between Trading and Non-Trading Hours: Like Night and Day. Working Paper, University of Utah. SSRN 1004081. — The foundational decomposition; documents that the US equity premium over 1993–2006 was due entirely to overnight returns. Underpins the hook and "Not a Fluke."
French, K. R., & Roll, R. (1986). Stock Return Variances: The Arrival of Information and the Reaction of Traders.Journal of Financial Economics, 17(1), 5–26. — The result that return variance is generated by trading, not calendar time. Backs the "Timing of Information" news-test (73% of the clock, 25% of the variance).
Lou, D., Polk, C., & Skouras, S. (2019). A Tug of War: Overnight Versus Intraday Expected Returns. Journal of Financial Economics, 134(1), 192–213. — The clientele / "tug of war" mechanism. Underpins "Participation and Clientele."
Hendershott, T., Livdan, D., & Rösch, D. (2020). Asset Pricing: A Tale of Night and Day. Journal of Financial Economics, 138(3), 635–662. — Beta is priced overnight and flat-to-negative intraday; the SML is nocturnal. The load-bearing citation for "Compensation for Systematic Risk" and the close.
Berkman, H., Koch, P. D., Tuttle, L., & Zhang, Y. J. (2012). Paying Attention: Overnight Returns and the Hidden Cost of Buying at the Open. Journal of Financial and Quantitative Analysis, 47(4), 715–741. — High opening prices that decay intraday; directly supports the open-auction slippage argument in "The Catch."
Branch, B., & Ma, A. (2012). Overnight Return, the Invisible Hand Behind Intraday Returns. Journal of Applied Finance, 22(2), 90–100. — Corroborating evidence on the overnight/intraday split.
Market efficiency & anomaly decay
McLean, R. D., & Pontiff, J. (2016). Does Academic Research Destroy Stock Return Predictability? The Journal of Finance, 71(1), 5–32. — Returns fall ~58% post-publication (~32% attributable to arbitrage). The citation behind the McLean–Pontiff / crowding point in "What the Dark Knows" and "The Catch."
Foundational asset pricing (referenced via the CAPM thread)
Sharpe, W. F. (1964). Capital Asset Prices: A Theory of Market Equilibrium Under Conditions of Risk. The Journal of Finance, 19(3), 425–442.
Black, F., Jensen, M. C., & Scholes, M. (1972). The Capital Asset Pricing Model: Some Empirical Tests. In M. C. Jensen (Ed.), Studies in the Theory of Capital Markets. New York: Praeger. — The "SML is too flat" result that Hendershott et al. extend; supports the beta-flat-intraday claim.
Data
Daily OHLC for QQQ, SPY, and the international country funds was drawn from a public mirror of the Huge Stock Market Dataset (Marjanovic, B., Kaggle), covering 1999–2017.
Further reading (practitioner / non-academic)
Elm Wealth (2022). Night Moves: Is the Overnight Drift the Grandmother of All Market Anomalies?
QuantPedia. Market Sentiment and an Overnight Anomaly / Overnight Anomaly research notes.
